Figure 2
Download original image
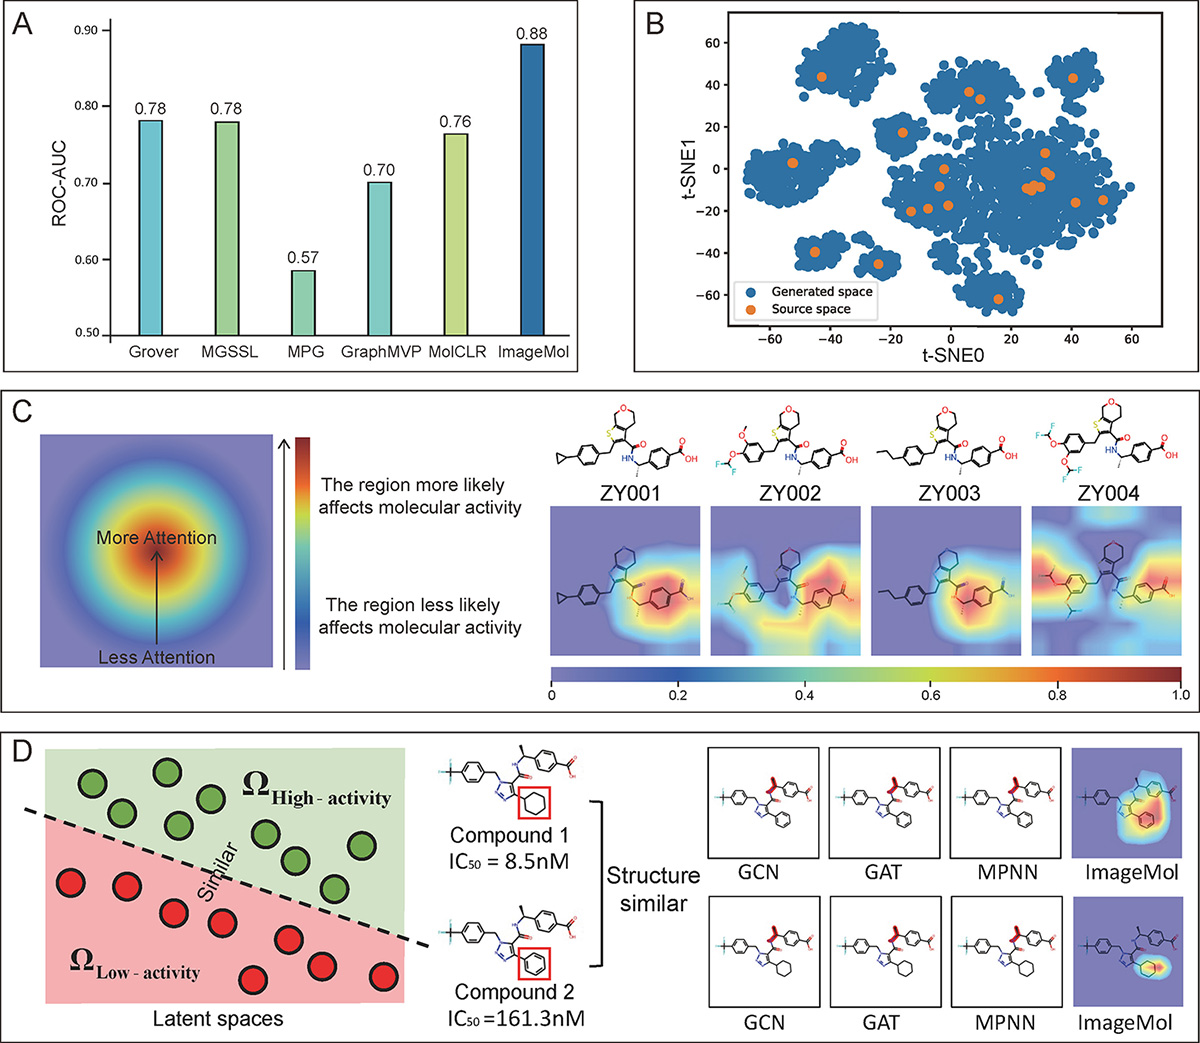
The performance of LeadDisFlow. (A) The performance of various screening models in classifying EP4 activity. (B) t-SNE plotted the chemical space of 3000 randomly selected generated molecules (blue) and EP4 compounds (orange). (C) Local of the final selected compounds images whose structures are highlighted by Grad-CAM. The warmer the colour, the more attention of the area, and these regions exert a greater influence on molecular activity. The colder the colour, the less attention of the area, and these regions have a lesser influence on molecular activity. (D) The comparative performance of graph-based and image-based methods in the task of activity cliff identification.
Current usage metrics show cumulative count of Article Views (full-text article views including HTML views, PDF and ePub downloads, according to the available data) and Abstracts Views on Vision4Press platform.
Data correspond to usage on the plateform after 2015. The current usage metrics is available 48-96 hours after online publication and is updated daily on week days.
Initial download of the metrics may take a while.