| Issue |
Natl Sci Open
Volume 4, Number 4, 2025
|
|
|---|---|---|
| Article Number | 20240015 | |
| Number of page(s) | 16 | |
| Section | Life Sciences and Medicine | |
| DOI | https://doi.org/10.1360/nso/20240015 | |
| Published online | 19 June 2025 | |
RESEARCH ARTICLE
Discovery of EP4 antagonists with image-guided explainable deep learning workflow
1
College of Information Science and Engineering, Hunan University, Changsha 410082, China
2
Shanghai Key Laboratory of Regulatory Biology, Institute of Biomedical Sciences and School of Life Sciences, Shanghai 200241, China
3
Department of General Surgery, Ruijin Hospital, Shanghai Jiao Tong University School of Medicine, Shanghai 200025, China
4
Department of AIDD, Shanghai Yuyao Biotechnology Co., Ltd., Shanghai 201109, China
5
Key Laboratory of Image Processing and Intelligent Control, School of Artificial Intelligence and Automation, Huazhong University of Science and Technology, Wuhan 430074, China
6
School of Computer Science and Technology, Xidian University, Xi’an 710071, China
7
School of Software, Shandong University, Jinan 250000, China
8
Institute of Fundamental and Frontier Sciences, University of Electronic Science and Technology of China, Chengdu 611731, China
9
Hainan Academy of Medical Sciences, Hainan Medical University, Haikou 570311, China
* Corresponding authors (emails: This email address is being protected from spambots. You need JavaScript enabled to view it.
(Xiangxiang Zeng); This email address is being protected from spambots. You need JavaScript enabled to view it.
(Weiqiang Lu))
Received:
30
August
2024
Revised:
25
March
2025
Accepted:
25
May
2025
Abstract
In target-based drug design, the manual creation of a poor initial compound library, the time-consuming wet-laboratory experimental screening method, and the weak explainability of their activity against compounds significantly limit the efficiency of discovering novel therapeutics. Here we propose an image-guided, interpretability deep learning workflow, named LeadDisFlow, to enable rapid, accurate target drug discovery. Using LeadDisFlow, we identified four potent antagonists with single-nanomolar antagonistic activity against PGE2 receptor subtype 4 (EP4), a promising target for tumor immunotherapy. Remarkably, the most potent EP4 antagonist, ZY001, demonstrated an IC50 value of (0.51 ± 0.02) nM, along with high selectivity. Furthermore, ZY001 effectively impaired the PGE2-induced gene expression of a panel of immunosuppressive molecules in macrophages. The workflow facilitates the discovery of potent EP4 antagonists that enhance anti-tumor immune response, and provides a convenient and quick approach to discover promising therapeutics for a specific drug target.
Key words: drug discovery / PGE2 receptor subtype 4 / antagonist / deep learning / computer vision
Contributed equally to this work.
© The Author(s) 2025. Published by Science Press and EDP Sciences.
 This is an Open Access article distributed under the terms of the Creative Commons Attribution License (https://creativecommons.org/licenses/by/4.0), which permits unrestricted use, distribution, and reproduction in any medium, provided the original work is properly cited.
INTRODUCTION
Targeted drugs intervene directly in disease progression by acting on molecular targets directly related to specific disease processes. Compared to traditional treatments, targeted drugs typically have fewer side effects and support personalized medicine [1,2]. They effectively improve progression-free survival and quality of life for some patients. Additionally, these drugs allow for the customization of treatment plans based on specific genetic and molecular characteristics of the patient, thereby enhancing the efficacy of the therapy [3]. Although targeted drugs offer unprecedented therapeutic potential, their development is characterized by high costs and extended research and development cycles [4]. In part, this is due to expensive and time-consuming wet-laboratory experiments and poor initial hit compounds. With the rapid development of deep learning, artificial intelligence (AI)-based tailor-made virtual compound library creation and virtual screening have the potential to mitigate these problems [5–8].
Upon identifying a molecular target, researchers compile a database of thousands to tens of thousands of candidate molecules to prepare for screening lead compounds. Improving the quality of the initial compounds’ libraries would minimize these lead optimization cycles and result in drug candidates that enter (pre-)clinical phases with greater specificity and higher affinity [9]. There are broadly two methods for the construction of candidate molecule libraries. One method utilizes existing compound libraries; for example, Stecula et al. [10] discovered novel inhibitors of a critical brain enzyme from 10 million commercially available compounds. Huang et al. [8] identified potent antimicrobial peptides from a comprehensive hexapeptide library containing 64 million sequences. Stokes et al. [7] discovered antibiotics from a synthesized large-scale database comprising nearly one hundred million compounds. Another method involves constructing the library through generative models; molecular generation models ensure the generation of large, tailor-made virtual compound libraries with high diversity and specificity. Li et al. [11] utilized a generative model to discover a potent and selective RIPK1 inhibitor. Zhavoronkov et al. [12] generated 30,000 unique, valid structures that enable the identification of potent DDR1 kinase inhibitors. Deng et al. [13] via goal-oriented molecule generation discovery and evaluation of 3quinoxalin urea derivatives as potent, selective, and orally available ATM inhibitors. Compared to the method of manually creating known compound libraries, this approach, utilizing generative models, excels in generating customized small molecule libraries for specific targets and provides access to untapped regions of the chemical space, extending the diversity of potential drug candidates [14,15].
However, regardless of the approach used, for the vast tailor-made molecular library, it is challenging to identify hit compounds for further biological validation; suitable experimental approaches are required to validate compounds in high throughput and at low cost. Molecular docking is a common method used in virtual screening, which involves selecting lead compounds by assessing the degree of binding tightness between the receptor and the ligand. Compared to the method of screening compounds through molecular docking [11,13,16], the rise of advanced AI technologies has motivated screening model applications to predict molecular properties more rapidly, ranging from bioactivity to biodistribution and physical properties. Molecular representation categories used for property prediction, and thus selecting the top candidates for subsequent validation, are diverse. Such as graph-based [17–19], sequence-based [20–22], 3D-based property predictions [23,24]. These representations are based on hand-crafted features and require significant domain knowledge [25]. Recently, novel image-based accurate molecular property predictions have appeared [26]. Visual computing enables the extraction of precise chemical characteristics at the pixel level [27]. In contrast to previously employed techniques, this computer vision-driven model possesses enhanced predictive accuracy and stronger interpretability [28,29], demonstrating a solid capacity for identifying biologically significant molecular structures or substructures from embedded molecular images. This capability holds great potential for users to analyze chemical structures and thus engage in drug discovery and development endeavors.
Generation models furnish screening models with large, diverse, and tailor-made compound libraries while screening models provide generation models with precise selection capability. These two general methods complement each other, eventually facilitating the development of new drugs and the better use of existing ones. Therefore, we designed a generation and screening workflow (LeadDisFlow) for targeted lead compound discovery (Figure 1A, C). Although empirical evidence ostensibly validates the theoretical effectiveness of these approaches, engendering the generation of molecules characterized by ostensibly propitious properties [30,31]. However, only some have been screened and verified through chemical synthesis and biological validation [32,33]. Their practical utility in drug research and development targeting specific targets is limited [34,35]. There is still a large gap between theoretical effectiveness and actual effectiveness [11]. To validate the capabilities of LeadDisFlow in real-world scenarios, we applied it to the discovery of EP4 antagonists.
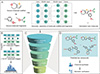 |
Figure 1 Establishment of the image-guided antagonist discovery workflow. (A) Illustration of the virtual compound library generator process: known active molecules are fragmented into scaffolds and molecular fragments, which are then reassembled using a deep learning model (decorator) to generate diverse and novel molecules. These molecules form the virtual compound library for further screening. (B) The construction process of the screening model: the EP4 activity dataset was used to finetune the property prediction model, ImageMol, which had been pre-trained on a large-scale self-supervised dataset. This resulted in a predictor capable of determining whether a molecule is active. (C) Thumbnails of virtual filters: From top to bottom, the steps and corresponding changes in the number of compounds during the process of screening the final hit compounds from the large-scale generated dataset are shown. (D) Description of the process for further manual screening, chemical synthesis, and biological verification: the top 50 compounds identified by the screening model were selected for these subsequent steps. |
Prostaglandin E2 (PGE2) receptors are a class of G protein-coupled receptors (GPCRs) consisting of four subtypes (EP1–EP4), which are activated by PGE2 to carry out key physiological and pathological functions [36]. EP1 receptor activates Gαq protein, EP3 receptor activates Gαi protein, while both EP2 and EP4 receptors are coupled with Gαs protein. Among these four subtypes, the EP4 receptor has been widely investigated and recognized as a promising drug target for cancer immunotherapy. Numerous studies have shown that the activation of EP4 receptor shapes the immunosuppressive tumor microenvironment via promoting the differentiation and proliferation of macrophages and inhibiting the infiltration and cytotoxicity of T cells and NK cells [37–39]. Until now, various EP4 antagonists have been discovered and disclosed [40–43]. Several are currently under clinical trials for solid tumors, such as E7046 [44] and CJ-023423 [40]. Therefore, finding potent EP4 antagonists holds great significance for treating and preventing cancer [45,46].
In this work, we present an image-guided deep learning workflow (LeadDisFlow) and then apply this workflow to the drug discovery against EP4, a promising target for tumor immunotherapy. Of note, four small molecules (ZY001, ZY002, ZY003, and ZY004) were subsequently chemically synthesized and biologically validated as potent EP4 antagonists with single nanomolar half maximal inhibitory concentration (IC50) values. Collectively, LeadDisFlow reduces the time and cost of drug discovery while its interpretability provides a solution for identifying quantitative structure-activity relationships and discovering novel chemical entities for a given target. This has important theoretical value and practical prospects for expediting the drug discovery process.
RESULTS
Developing an image-guided deep learning workflow
LeadDisFlow comprises two distinct phases, “generation” and “screening,” which correspond to LeadDisFlow-G and LeadDisFlow-S, respectively. LeadDisFlow-G is a sequence processing recurrent neural network (RNN) conditioned on scaffolds; by using existing active compounds as prior knowledge, RNN can find data patterns and generate lead compounds that satisfy preset requirements autonomously. LeadDisFlow-S is a self-supervised molecular property prediction model used to learn molecular structures from large-scale molecular images, providing a powerful tool for rapid property prediction (Table S7) and development for various emerging diseases.
Figure 1A, C delineates the methodological process of identifying EP4 receptor antagonists via LeadDisFlow. By collecting patents targeting the EP4 receptor and supervised datasets from the CHEMBL and other databases, the decorator of LeadDisFlow-G learns about the potential binding affinities and modalities of molecular scaffolds and fragments. Subsequently, when scaffolds are input into LeadDisFlow-G, it autonomously discerns the optimal decoration strategy, generating a customized virtual compound library tailored to EP4. These compounds are then screened for superior candidates by the property prediction model, LeadDisFlow-S (Figure 1C), for the next step of chemical synthesis and biological validation (Figure 1D). In the entirety of the compound discovery process utilizing LeadDisFlow-G, three enhanced strategies were implemented to augment the capacity for generator hit compounds for the designated target: regularization enhancement, sequential double processing, and multi-attention mechanism.
Regularization enhancement. The incorporation of noise into hidden states is pursued to bolster generalization capabilities, a strategy poised to enhance the model’s robustness, prevent overfitting, stabilize the model, and effectively attenuate the implications of internal covariate shift [47,48]. Specifically, we first generate random numbers from a Gaussian distribution with the same shape as the hidden states and multiply them by the standard deviation to get a random perturbation with a specified noise level. This perturbation is then added to the original hidden states, producing new ones imbued with a specified degree of noise.
Dual processing of sequences. Long short-term memory (LSTM) [49] and gated recurrent unit (GRU) [50], both paramount neural network models, are ubiquitously employed in sequence modeling, attributed to their analogous foundational structures yet divergent gating mechanisms and memory cell formats. These disparities engender flexibility and adaptability in their respective information flows, conducive to a spectrum of sequence modeling tasks [51,52]. Combining their outputs can leverage their commonalities and differences, achieving better representation capacity and generalization performance [53]. Specifically, the LSTM and GRU process the input data in parallel, with their outputs being aggregated in the terminal phase, enabling the model to attain superior temporal representation capabilities and more efficaciously capture salient features and information within the sequence.
Multi-attention mechanism. In numerous sequence modeling endeavors, contemplation of intra-feature relationships and inter-temporal step associations-typically exhibiting interdependence-becomes imperative. A singular attention mechanism frequently falls short of comprehensively addressing this complexity. The concurrent implementation of channel and global attention mechanisms affords a comprehensive approach, maximizing their intrinsic characteristics to facilitate enhanced feature selection and amalgamation. The channel attention mechanism helps the model adaptively adjust the importance of different channels in the input data. This highlights the features that are meaningful and contribute to the current task. The global attention mechanism, on the other hand, captures the associations between different time steps in the input data. It integrates the information from these time steps through weighted summation to obtain a more comprehensive and accurate sequence representation. The synergistic combination of both mechanisms propels the model toward an enriched understanding and processing of complex sequence data, achieving a heightened efficacy in feature selection and integration. Specifically, the squeeze-and-excitation block [54] is employed within the input sequence to refine and optimize inter-channel relationships within the input data, thus augmenting the model’s perceptual capacity for internal feature relevance. Concurrently, within the summed outputs for both directions of the encoder in each step, harmonized with the production of the current step of the decoder, the global attention mechanism is utilized to optimize the relationships between various positions or time steps within the input data, thereby enhancing the capacity to process sequences with extensive temporal dependencies.
In the phase of LeadDisFlow-S, due to poor molecular representation resulting from limited data, we adopt transfer learning to improve the model screening capability in the case of limited datasets. In this study, we compared the classification performance of six pre-trained and fine-tuned property prediction models on the EP4 dataset using the ROC-AUC metric. These models include GROVER [19], MGSSL [18], MPG [55], GraphMVP [56], MolCLR [57], and ImageMol [26]. Following the comparative analysis (Figure 2A), we selected ImageMol, which demonstrated the best performance, for further application in transfer learning. ImageMol is first pre-trained on a dataset of nearly ten million PubChem molecular images [58], and then fine-tuned on our collected EP4 supervised dataset, resulting in a specific screening model targeted at the EP4 receptor (Figure 1B).
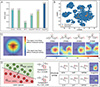 |
Figure 2 The performance of LeadDisFlow. (A) The performance of various screening models in classifying EP4 activity. (B) t-SNE plotted the chemical space of 3000 randomly selected generated molecules (blue) and EP4 compounds (orange). (C) Local of the final selected compounds images whose structures are highlighted by Grad-CAM. The warmer the colour, the more attention of the area, and these regions exert a greater influence on molecular activity. The colder the colour, the less attention of the area, and these regions have a lesser influence on molecular activity. (D) The comparative performance of graph-based and image-based methods in the task of activity cliff identification. |
Generation of a tailor-made virtual compound library for EP4 and predicting new EP4 antagonist candidates
We aim to harness AI to unearth lead compounds exhibiting pronounced antagonistic activity against the EP4 receptor. We used 28 potential antagonists from a patent (CN109836434A, Table S3) with known IC50 values below 10,000 nM and synthetic accessibility as inputs for inference in LeadDisFlow-G. As a result, we generated 140,569 unique and valid compounds, creating a custom-tailored, extensive virtual compound library for EP4. In order to demonstrate the LeadDisFlow-G’s explore new chemical space capacity and show the distribution of the data relation, we separately generated a t-SNE (Figure 2B) figure, tree maps (TMAPS [59]) (Figure S1), the structural similarity between ZY001–ZY004 and the source dataset (Table S5), and the number of novel scaffolds generated in the virtual screening library (Table S6). As shown in Figure 2B, the clusters labeled as “Generated space” represent the novel chemical space explored by LeadDisFlow-G, which are clearly dispersed beyond the boundaries of the “Source space”. This t-SNE visualization highlights the effectiveness of LeadDisFlow-G in expanding the chemical space. Specifically, ZY001–ZY004 exhibit a low structural similarity of 0.17 to the training set, indicating that they are significantly distinct from the molecules used during training. Meanwhile, their similarity to the inference dataset is 0.61, suggesting that while the model leverages information from the inference data, it also demonstrates the capacity to generalize and innovate beyond the training data. Furthermore, the LeadDisFlow-G generated 140,569 unique molecules based on 28 inference molecules (10 distinct scaffolds), yielding 10,163 novel scaffolds. This substantial scaffold diversity illustrated the LeadDisFlow-G’s ability to generalize beyond the confines of both the training and inference datasets, effectively exploring uncharted chemical spaces.
Following that, we performed virtual screening on the chemical library generated to find lead compounds with drug-like properties that target EP4 (Figure 1C). Significant physiochemical metrics pertaining to drug-like characteristics were computed during the initial phase. The dataset was then refined to 46,116 compounds based on specific molecular descriptor thresholds: 450 ≤ MW ≤ 600, 5 ≤ LogP ≤ 8, 0.25 ≤ QED, 0.8 ≤ SA, TPSA ≤ 100, HBA ≤ 10, HBD ≤ 5, and rot < 12. Furthermore, we applied additional filtering rules: we required the inclusion of benzoic acid in the structure and restricted the number of aromatic rings to no more than four. This meticulous procedure resulted in a final set of 19,250 compounds. These structures were utilized to compute ECFP fingerprints for clustering [60], grouping structurally similar compounds into the same clusters. To ensure diversity among the compounds, we created 100 clusters and randomly selected 20 molecules from each cluster (Figure S2). We gathered molecular data for 1,648 known active molecules targeting EP4 from sources like BindingDB [61], ChEMBL [62], website and patents. Labels were assigned 1 (high activity molecules) for IC50 values ≤ 10 nM and 0 (low activity molecules) for values >10 nM for finetune LeadDisFlow-S. To assess the performance of ImageMol on the EP4 datasets, we employed a widely used splitting strategy known as scaffold split. This technique divides datasets based on distinct molecular substructures. The substructures in the training set (80%), validation set (10%), and test set (10%) are mutually exclusive, making scaffold split ideal for testing model robustness and generalizability. In the classification task, we evaluated ImageMol’s performance using the area under the receiver operating characteristic (ROC) curve (AUC). Across the EP4 dataset, ImageMol achieved impressive AUC values, specifically AUC = 0.88. We also employed ImageMol to score the 2000 compounds selected within the clusters, identifying the top 50 molecules (~2.5%). From this highly ranked set of 50 molecules (Figure S3), we chose four candidates (ZY001, ZY002, ZY003, and ZY004) with relatively accessible synthetic routes for subsequent chemical synthesis. The synthetic feasibility of these compounds was evaluated by our chemical synthesis team.
Validation of the advantages of image-guided drug discovery methods
Figure 2A demonstrates the superiority of this image-guided approach over other deep learning methods in the classification of EP4 antagonists. Furthermore, the image-guided method also holds an advantage in terms of interpretability regarding the functional groups that influence molecular activity. In the tailor-made virtual compound libraries generated by LeadDisFlow-G, many structurally similar molecules may exhibit significantly different properties (Figure S4). This phenomenon is known as an activity cliff. These molecules play a crucial role in the explainability of activity. As depicted in Figure 2D and Figure S5, ΩHigh-activity represents a group of highly active molecules, while ΩLow-activity represents a group of lowly active molecules. A pair of molecules in the high and low activity regions (red and blue points within the area) exemplifies an activity cliff, where they are structurally similar, yet their activities differ significantly. To investigate the capability of this image-guided drug screening approach in terms of molecular activity explainability, we further compared our screen model (ImageMol) with graph-based methods on the task of activity cliffs, specifically with GCN [63], GAT [64], and MPNN [65]. As shown in Figure 2D, compounds 1 and 2 have highly similar overall structures, differing only in a cyclohexane ring versus a benzene ring. However, due to the activity cliff issue, there is nearly a 20-fold difference in activity (8.5 and 161.3 nM). It was found that none of the three graph-based methods successfully focused on the most critical positions affecting activity. However, ImageMol accurately captures the substructures influencing molecular activity, demonstrating the reliability of the image-based approach as a screening model. By precisely analyzing substructures that significantly influence activity, this method facilitates drug optimization and provides better insights into the activity of functional groups. For the EP4 receptor, benzoic acid constitutes an important pharmacophore, significantly influencing the activity of many EP4 antagonists [41,42]. As shown in Figure 2C, the fine-tuned ImageMol can accurately focus on the image’s important information (including benzoic acid), consistent with people’s prior knowledge.
Drug-likeness analysis of lead compounds ZY001–ZY004
We initially employed the SwissADME tool [66] to evaluate the synthesized compounds ZY001–ZY004 for their drug-like properties and medicinal chemistry friendliness. Tables S1 and S2 provide a summary of these results (with complete analysis reports available in Figures S6–S9). Notably, ZY001 fulfilled all drug-likeness principles. All four compounds exhibited a medium level of bioavailability and did not contain any medicinal chemistry alerts.
Chemical synthesis of lead compounds ZY001–ZY004
Starting material tetrahydro-4H-pyran-4-one (1) was reacted with ethyl cyanoacetate and sulfur to obtain intermediate 2 (ethyl 2-amino-4,7-dihydro-5H-thieno[2,3-c]pyran-3-carboxylate). Next, intermediate 2 was reacted with tert-butyl nitrite and CuBr2 to yield intermediate 3 (ethyl 2-bromo-4,7-dihydro-5H-thieno[2,3-c]pyran-3-carboxylate), which was then coupled with different commercially available aldehydes to afford the hydroxyl compounds 4a-d. Intermediate 4a-d were reacted with trifluoroacetic acid and triethylsilane to remove the hydroxyl group. Subsequently, Intermediate 5a-d were hydrolyzed, reacted with methyl-4-[(1S)-1-aminoethyl]benzoate, and ester hydrolysis to produce the desired compounds ZY001–ZY004 (Figure 3).
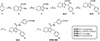 |
Figure 3 The synthetic route of ZY001–ZY004. Reagents and conditions: (a) S, ethyl cyanoacetate, morpholine, EtOH, 60 °C, 9 h; (b) tert-butyl nitrite, CuBr2, MeCN, 1,4-dioxane, 0 °C to room temperature (rt), 5 h; (c) benzaldehyde derivatives, n-BuLi, Et2O, −78 °C to rt, 6 h; (d) TFA, Et3SiH, DCM, 0 °C, 2 h; (e) LiOH·H2O, THF/MeOH/H2O = 2:2:1, 45 °C, 2 h; (f) methyl-4-[(1S)-1-aminoethyl]benzo-ate, HATU, DIPEA, DMF, rt, 6 h. |
Biological validation of lead compounds ZY001–ZY004
The candidate compounds ZY001–ZY004 were then experimentally tested for their antagonistic activity against EP4 receptor. EP4 binds to Gαs and activates adenylyl cyclase, resulting in increased intracellular cAMP levels [67]. GloSensor cAMP assay is a highly reliable and easy-to-use analysis method that detects the intracellular concentration of cAMP using a luciferase biosensor [68]. As shown in Figure 4A–D, four compounds showed strong antagonistic activity against EP4 with single-nanomolar IC50 values. Notably, ZY001 was the most potent one with an IC50 value of (0.51 ± 0.02) nM against EP4. Subsequently, ZY001 and ZY003 were chosen for further activity profiling. PGE2 increased the cAMP levels in EP4-overexpressing HEK293 cells in a dose-dependent manner. Significantly, increasing the concentrations of ZY001 and ZY003 induced right-forward of PGE2 response curve without modifying the peak level of cAMP (Figure 4I, K). Moreover, the schild plot analysis showed a pA2 value of 8.596 with a slope of 1.014 for ZY001, along with a pA2 value of 8.239 with a slope of 0.985 for ZY003, respectively (Figure 4J, L). In addition, a strong antagonistic potency of ZY001 was observed in CRE reporter assay (Figure 4E), and ZY001 had negligibly antagonistic activity against EP1–3 receptors (IC50 >10 μM), demonstrating a high selectivity (Figure 4F–H). Together, these findings demonstrated that ZY001–ZY004 are highly potent EP4 antagonists.
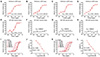 |
Figure 4 Experimental confirmation of ZY001–ZY004 as highly potent EP4 antagonists. (A–D) Dose-response curves of ZY001 (A), ZY002 (B), ZY003 (C), and ZY004 (D) against EP4 in GloSensor cAMP assay, respectively (n = 3). (E) Dose-response curves of ZY001 against EP4 in CRE reporter assay (n = 3). (F) Dose-response curves of ZY001 against EP1 in NFAT reporter assay (n = 3). (G, H) Dose-response curves of ZY001 against EP2 (G) and EP3 (H) in CRE reporter assay (n = 3). (I) Schild plot analyses of ZY001 in the GloSensor cAMP assay. (J) The pA2 and slope of this Schild plot (I) were 8.596 and 1.014, respectively. (K) Schild plot analyses of ZY003 in the GloSensor cAMP assay. (L) The pA2 and slope of this Schild plot (K) were 8.239 and 0.985, respectively. Data were shown as the mean ± SEM. |
Docking analysis of ZY001 to EP4 receptor
Subsequently, we explored the binding model of ZY001 with EP4 receptor through molecular docking simulations (Figure 5). The published crystal structure of the EP4 receptor and its antagonist ONO-AE3-208 was used as a template (PDB ID: 5YWY) [69]. As shown in Figure 5, the carboxyl group of ZY001 formed strong hydrogen bonds with Tyr80, Thr168 and salt bridge with Arg316, while the amide group formed hydrogen bonds with Thr76 and Ser319. This confirms that ZY001 adopts a binding mode highly similar to ONO-AE3-208, targeting critical residues required for EP4 antagonism. Furthermore, ZY001 exhibited a similar Vina score to the active molecules we collected, indicating a potential similar binding mode (Figure S10). Meanwhile, the thienocyclic scaffold occupied the hydrophobic pocket, forming π-π stacking and van der Waals interactions with surrounding amino acid residues.
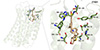 |
Figure 5 Predicted binding model of ZY001 to EP4 receptor. Green dashed lines indicate hydrogen bonding interactions, grey dashed lines indicate hydrophobic interactions, and the dashed yellow line shows the salt bridge. |
ZY001 effectively impaired the expression of immunosuppressive molecules in macrophages
A variety of studies have shown that PGE2/EP4 signaling enhanced the expression of immunosuppressive molecules in macrophages, including Il4, Mrc1, Chil3, Trem2 and Ptgs2 [37,70,71]. Inflammatory factor IL4 promotes the polarization of M2 macrophages, which could facilitate tumor progression [72]. Macrophage mannose receptor (MRC1) and chitinase-like protein 3 (CHIL3) are the pro-tumorigenic markers of macrophages that exhibit potent immunosuppressive activity [73,74]. Trigger receptor expressed on myeloid cell 2 (TREM2) and cyclooxygenase 2 (PTGS2) strongly suppressed the anti-tumor immune response induced by CD8+ T cells [75]. To investigate the effect of ZY001 on the expression of immunosuppressive molecules, we selected the murine macrophage cell line Raw 264.7. As shown in Figure 6A–E, treatment of Raw 264.7 cells with PGE2 dramatically raised the expression of immunosuppressive molecules, including Il4 (2.2-fold, P < 0.01), Mrc1 (2.9-fold, P < 0.02), Chil3 (3.3-fold, P < 0.01), Trem2 (3.6-fold, P < 0.0001) and Ptgs2 (9.7-fold, P < 0.0001). Of note, ZY001 dose-dependently impaired the PGE2-induced up-regulation of these immunosuppressive molecules in macrophages. In conclusion, these results demonstrated that ZY001 profoundly impaired the expression of immunosuppressive molecules in macrophages.
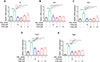 |
Figure 6 ZY001 inhibited the expression of immunosuppressive molecules in Raw 264.7 cells. Mouse Raw 264.7 macrophages were treated with E7046 (10 μM) or ZY001 (0.1, 1, 10 μM) in the existence of PGE2 (40 nM) for 24 h. The mRNA expression of Il4 (A), Mrc1 (B), Chil3 (C), Trem2 (D) and Ptgs2 (E) were determined by Q-PCR. Gapdh was used as a reference gene. Data were shown as the mean ± SEM. One-way ANOVA followed by Tukey’s post hoc tests were performed; *P < 0.05; **P < 0.01; ***P < 0.001; and ****P < 0.0001. |
DISCUSSION
In this paper, we proposed a target-based lead compound discovery workflow designed to seamlessly integrate the entire process from molecular generation to lead compound selection. LeadDisFlow comprises two crucial components: (1) Tailoring candidate ligand libraries for specific targets: LeadDisFlow can generate customized small molecule libraries tailored to specific targets. This approach provides access to previously unexplored regions within the chemical space, thereby expanding the diversity of potential drug candidates. (2) High-throughput screening method: LeadDisFlow employs a high-throughput screening approach that utilizes molecular images as the feature representation of compounds. This method offers a combination of high accuracy and low computational cost, enabling the capture of essential structural information within molecules. Moreover, by using various visualization analyses, including gradient-weighted class activation mapping (Grad-CAM), activity cliff and multi-granularity chemical clustering, we showed high biological interpretation of LeadDisFlow in identifying biologically relevant molecular structures or substructures from the embedded molecular images for drug discovery and development users.
We acknowledge several limitations. Our current LeadDisFlow workflow operates within a two-dimensional space and does not utilize the three-dimensional structural information of ligands and receptors. While this approach reduces computational complexity, it inevitably leads to insufficient chemical information and lower specificity of the generated molecules. LeadDisFlow-G, being a scaffold-based molecular generation method, ensures higher activity of molecules generated under the premise of prior active molecules, but this also implies a potential inability to achieve scaffold hopping, thus limiting the exploration of chemical space. Several potential directions may improve LeadDisFlow further: (1) integrating structural-based molecular generation (SBDD) concepts [76–78] to incorporate spatial structural information of receptor-ligands; (2) employing multimodal learning to fuse more modalities for generation and screening; (3) utilizing dynamic information from molecular dynamics [79] for molecular generation; (4) generating molecules that conform to multiple properties [80] (such as toxicity, pharmacokinetics, multi-target activity) through constrained molecular generation; (5) introducing optimization steps to achieve single or multi-objective optimization of molecular properties [81]; (6) exploration of generation and optimization models under few-shot scenarios to address cases with scarce data, such as rare diseases and multi-target drugs; (7) explore the generalizability of the drug design workflow by applying the same process across multiple targets, validated through the activity prediction rate and whether docking occurs at the correct residues. Moreover, this proof-of-concept study validates the effectiveness of this workflow for the EP4 target. In this work, we constructed a Vast tailor-made virtual compound library and successfully identified four potent EP4 antagonists (ZY001–ZY004) by applying LeadDisFlow. Among them, ZY001 has an IC50 value of (0.51 ± 0.02) nM against EP4 and exhibits excellent selectivity. This application example demonstrated the effectiveness and great potential of LeadDisFlow. Moreover, not only applicable to EP4, LeadDisFlow could also be applied to any given target by collecting relevant data and retraining. This has important theoretical value and practical prospects for expediting the drug discovery process.
Funding
This work was supported by the National Natural Science Foundation of China (62425204, 62122025, U22A2037, 62450002, 62432011, 62250028, 81972828, 82172644, and 81830083), Hunan Provincial Natural Science Foundation of China (2021JJ10020), National Key Scientific Infrastructure for Translational Medicine (Shanghai) (TMSK-2021-120), and ECNU Multifunctional Platform for Innovation (011).
Author contributions
W.L. and X.Z. conceived the work. P.M. and Z.X.C. established the LeadDisFlow and carried out computer experiments; Z.Y.C. conducted chemical experiments and coordinated all validation experiments; Y.W. and X.C. carried out biological experiments under the supervision. W.L., X.Z., P.M., Z.Y.C., Z.X.C., Y.W., X.C., H.X., B.F., L.Z., X.L., P.L., L.W., Q.Z., and M.L. performed data analyses and interpreted all results. P.M., Z.Y.C., and Y.W. wrote the original manuscript. P.M. and Z.Y.C. critically revised the manuscript. P.M. and Z.Y.C. contributed equally to this study. All authors have given approval to the final version of the manuscript.
Conflict of interest
The authors declare no competing interests.
Supplementary information
Supplementary file provided by the authors. Access Supplementary Material
References
- Sun Y, Ma X, Hu H. Application of nano-drug delivery system based on cascade technology in cancer treatment. Int J Mol Sci 2021; 22: 5698. [Article] [Google Scholar]
- Amber KT, Maglie R, Solimani F, et al. Targeted therapies for autoimmune bullous diseases: Current status. Drugs 2018; 78: 1527-1548. [Article] [Google Scholar]
- Yu C, Liu X, Yang J, et al. Combination of immunotherapy with targeted therapy: Theory and practice in metastatic melanoma. Front Immunol 2019; 10: 990. [Article] [CrossRef] [PubMed] [Google Scholar]
- DiMasi JA, Grabowski HG, Hansen RW. Innovation in the pharmaceutical industry: New estimates of R&D costs. J Health Econ 2016; 47: 20-33. [Article] [CrossRef] [PubMed] [Google Scholar]
- Aittokallio T. What are the current challenges for machine learning in drug discovery and repurposing?. Expert Opin Drug Discov 2022; 17: 423-425. [Article] [Google Scholar]
- Pandey M, Fernandez M, Gentile F, et al. The transformational role of GPU computing and deep learning in drug discovery. Nat Mach Intell 2022; 4: 211-221. [Article] [Google Scholar]
- Stokes JM, Yang K, Swanson K, et al. A deep learning approach to antibiotic discovery. Cell 2020; 180: 688-702.e13. [Article] [CrossRef] [PubMed] [Google Scholar]
- Huang J, Xu Y, Xue Y, et al. Identification of potent antimicrobial peptides via a machine-learning pipeline that mines the entire space of peptide sequences. Nat Biomed Eng 2023; 7: 797-810. [Article] [Google Scholar]
- Gorgulla C, Boeszoermenyi A, Wang ZF, et al. An open-source drug discovery platform enables ultra-large virtual screens. Nature 2020; 580: 663-668. [Article] [Google Scholar]
- Stecula A, Hussain MS, Viola RE. Discovery of novel inhibitors of a critical brain enzyme using a homology model and a deep convolutional neural network. J Med Chem 2020; 63: 8867-8875. [Article] [Google Scholar]
- Li Y, Zhang L, Wang Y, et al. Generative deep learning enables the discovery of a potent and selective RIPK1 inhibitor. Nat Commun 2022; 13: 6891. [Article] [Google Scholar]
- Zhavoronkov A, Ivanenkov YA, Aliper A, et al. Deep learning enables rapid identification of potent DDR1 kinase inhibitors. Nat Biotechnol 2019; 37: 1038-1040. [Article] [Google Scholar]
- Deng D, Yang Y, Zou Y, et al. Discovery and evaluation of 3-quinoxalin urea derivatives as potent, selective, and orally available ATM inhibitors combined with chemotherapy for the treatment of cancer via goal-oriented molecule generation and virtual screening. J Med Chem 2023; 66: 9495-9518. [Article] [Google Scholar]
- Segler MHS, Kogej T, Tyrchan C, et al. Generating focused molecule libraries for drug discovery with recurrent neural networks. ACS Cent Sci 2018; 4: 120-131. [Article] [Google Scholar]
- Sadybekov AV, Katritch V. Computational approaches streamlining drug discovery. Nature 2023; 616: 673-685. [Article] [CrossRef] [PubMed] [Google Scholar]
- Tan X, Li C, Yang R, et al. Discovery of pyrazolo[3,4-d]pyridazinone derivatives as selective DDR1 inhibitors via deep learning based design, synthesis, and biological evaluation. J Med Chem 2021; 65: 103-119. [Article] [Google Scholar]
- Cai H, Zhang H, Zhao D, et al. FP-GNN: A versatile deep learning architecture for enhanced molecular property prediction. Brief Bioinform 2022; 23: bbac408. [Article] [Google Scholar]
- Zhang Z, Liu Q, Wang H, et al. Motif-based graph self-supervised learning for molecular property prediction. Adv Neural Inf Process Syst 2021; 34: 15870–15882 [Google Scholar]
- Rong Y, Bian Y, Xu T, et al. Self-supervised graph transformer on large-scale molecular data. Adv Neural Inf Process Syst 2020; 33: 12559–12571 [Google Scholar]
- Shao J, Gong Q, Yin Z, et al. S2DV: Converting SMILES to a drug vector for predicting the activity of anti-HBV small molecules. Brief Bioinform 2022; 23: bbab593. [Article] [Google Scholar]
- Zhang XC, Wu CK, Yang ZJ, et al. MG-BERT: Leveraging unsupervised atomic representation learning for molecular property prediction. Brief Bioinform 2021; 22: bbab152. [Article] [Google Scholar]
- Xue D, Zhang H, Chen X, et al. X-MOL: Large-scale pre-training for molecular understanding and diverse molecular analysis. Sci Bull 2022; 67: 899-902. [Article] [Google Scholar]
- Wang X, Zhao H, Tu W, et al. Automated 3d pre-training for molecular property prediction. In: Proceedings of the 29th ACM SIGKDD Conference on Knowledge Discovery and Data Mining. New York, 2023, 2419–2430 [Google Scholar]
- Stärk H, Beaini D, Corso G, et al. 3D infomax improves GNNs for molecular property prediction. In: Proceedings of the 39th International Conference on Machine Learning. PMLR, 2022, 20479–20502 [Google Scholar]
- Gallegos LC, Luchini G, St John PC, et al. Importance of engineered and learned molecular representations in predicting organic reactivity, selectivity, and chemical properties. Acc Chem Res 2021; 54: 827-836. [Article] [Google Scholar]
- Zeng X, Xiang H, Yu L, et al. Accurate prediction of molecular properties and drug targets using a self-supervised image representation learning framework. Nat Mach Intell 2022; 4: 1004-1016. [Article] [Google Scholar]
- Li J, Telychko M, Yin J, et al. Machine vision automated chiral molecule detection and classification in molecular imaging. J Am Chem Soc 2021; 143: 10177-10188. [Article] [Google Scholar]
- Pei Y, Wang G, Cao H, et al. A deep-learning pipeline to diagnose pediatric intussusception and assess severity during ultrasound scanning: A multicenter retrospective-prospective study. npj Digit Med 2023; 6: 182. [Article] [Google Scholar]
- Zhang Z, Xie Y, Xing F, et al. Mdnet: A semantically and visually interpretable medical image diagnosis network. In: Proceedings of the IEEE Conference on Computer Vision and Pattern Recognition. Honolulu, 2017, 6428–6436 [Google Scholar]
- Sousa T, Correia J, Pereira V, et al. Generative deep learning for targeted compound design. J Chem Inf Model 2021; 61: 5343-5361. [Article] [Google Scholar]
- Born J, Manica M. Regression Transformer enables concurrent sequence regression and generation for molecular language modelling. Nat Mach Intell 2023; 5: 432-444. [Article] [Google Scholar]
- Xie C, Zhuang XX, Niu Z, et al. Amelioration of Alzheimer’s disease pathology by mitophagy inducers identified via machine learning and a cross-species workflow. Nat Biomed Eng 2022; 6: 76-93. [Article] [Google Scholar]
- Diao Y, Liu D, Ge H, et al. Macrocyclization of linear molecules by deep learning to facilitate macrocyclic drug candidates discovery. Nat Commun 2023; 14: 4552. [Article] [Google Scholar]
- Renz P, Van Rompaey D, Wegner JK, et al. On failure modes in molecule generation and optimization. Drug Discov Today Technol 2019; 32-33: 55-63. [Article] [Google Scholar]
- Meyers J, Fabian B, Brown N. De novo molecular design and generative models. Drug Discov Today 2021; 26: 2707-2715. [Article] [Google Scholar]
- Woodward DF, Jones RL, Narumiya S. International union of basic and clinical pharmacology. LXXXIII: Classification of prostanoid receptors, updating 15 years of progress. Pharmacol Rev 2011; 63: 471-538. [Article] [Google Scholar]
- Lu W, Yu W, He J, et al. Reprogramming immunosuppressive myeloid cells facilitates immunotherapy for colorectal cancer. EMBO Mol Med 2021; 13: e12798. [Article] [Google Scholar]
- Peng S, Hu P, Xiao YT, et al. Single-cell analysis reveals EP4 as a target for restoring T-cell infiltration and sensitizing prostate cancer to immunotherapy. Clin Cancer Res 2022; 28: 552-567. [Article] [Google Scholar]
- Bonavita E, Bromley CP, Jonsson G, et al. Antagonistic inflammatory phenotypes dictate tumor fate and response to immune checkpoint blockade. Immunity 2020; 53: 1215-1229.e8. [Article] [Google Scholar]
- Nakao K, Murase A, Ohshiro H, et al. CJ-023,423, a novel, potent and selective prostaglandin EP4 receptor antagonist with antihyperalgesic properties. J Pharmacol Exp Ther 2007; 322: 686-694. [Article] [Google Scholar]
- Yang JJ, Yu WW, Hu LL, et al. Discovery and characterization of 1H-1,2,3-triazole derivatives as novel prostanoid EP4 receptor antagonists for cancer immunotherapy. J Med Chem 2019; 63: 569-590. [Article] [Google Scholar]
- Blouin M, Han Y, Burch J, et al. The discovery of 4-{1-[({2,5-dimethyl-4-[4-(trifluoromethyl)benzyl]-3-thienyl}carbonyl)amino]cyclopropyl}benzoic Acid (MK-2894), a potent and selective prostaglandin E2 subtype 4 receptor antagonist. J Med Chem 2010; 53: 2227-2238. [Article] [Google Scholar]
- Cheng Z, Wang Y, Zhang Y, et al. Discovery of 2 H-indazole-3-carboxamide derivatives as novel potent prostanoid EP4 receptor antagonists for colorectal cancer immunotherapy. J Med Chem 2023; 66: 6218-6238. [Article] [Google Scholar]
- Hong DS, Parikh A, Shapiro GI, et al. First-in-human phase I study of immunomodulatory E7046, an antagonist of PGE2-receptor E-type 4 (EP4), in patients with advanced cancers. J Immunother Cancer 2020; 8: e000222. [Article] [Google Scholar]
- Das D, Hong J. Prostaglandin E2 receptor 4 (EP4): A promising therapeutic target for the treatment of cancer and inflammatory diseases. Curr Chem Biol 2021; 15: 50-68. [Article] [Google Scholar]
- Akbari B, Soltantoyeh T, Shahosseini Z, et al. PGE2-EP2/EP4 signaling elicits mesoCAR T cell immunosuppression in pancreatic cancer. Front Immunol 2023; 14: 1209572. [Article] [Google Scholar]
- Liu X, Xiao T, Si S, et al. How does noise help robustness? Explanation and exploration under the neural SDE framework. In: Proceedings of the IEEE/CVF Conference on Computer Vision and Pattern Recognition. Seattle, 2020, 282–290 [Google Scholar]
- Bishop CM. Training with noise is equivalent to Tikhonov regularization. Neural Computation 1995; 7: 108-116. [Article] [CrossRef] [Google Scholar]
- Graves A, Graves A. Long short-term memory. In: Supervised Sequence Labelling with Recurrent Neural Networks. Studies in Computational Intelligence. Berlin, Heidelberg: Springer, 2012. 37–45 [Google Scholar]
- Cho K, van Merrienboer B, Gulcehre C, et al. Learning phrase representations using RNN encoder-decoder for statistical machine translation. ArXiv:1406.1078 [Google Scholar]
- ArunKumar KE, Kalaga DV, Mohan Sai Kumar C, et al. Comparative analysis of Gated Recurrent Units (GRU), long Short-Term memory (LSTM) cells, autoregressive Integrated moving average (ARIMA), seasonal autoregressive Integrated moving average (SARIMA) for forecasting COVID-19 trends. Alex Eng J 2022; 61: 7585-7603. [Article] [Google Scholar]
- Sherstinsky A. Fundamentals of recurrent neural network (RNN) and long short-term memory (LSTM) network. Phys Nonlinear Phenom 2020; 404: 132306. [Article] [Google Scholar]
- ArunKumar KE, Kalaga DV, Kumar CMS, et al. Forecasting of COVID-19 using deep layer recurrent neural networks (RNNs) with gated recurrent units (GRUs) and long short-term memory (LSTM) cells. Chaos Solitons Fractals 2021; 146: 110861. [Article] [Google Scholar]
- Hu J, Shen L, Sun G. Squeeze-and-excitation networks. In: Proceedings of the IEEE Conference on Computer Vision and Pattern Recognition. Salt Lake City, 2018, 7132–7141 [Google Scholar]
- Li P, Wang J, Qiao Y, et al. An effective self-supervised framework for learning expressive molecular global representations to drug discovery. Brief Bioinform 2021; 22: bbab109. [Article] [Google Scholar]
- Liu S, Wang H, Liu W, et al. Pre-training molecular graph representation with 3D geometry. ArXiv:2110.07728 [Google Scholar]
- Wang Y, Wang J, Cao Z, et al. Molecular contrastive learning of representations via graph neural networks. Nat Mach Intell 2022; 4: 279-287. [Article] [Google Scholar]
- Kim S, Chen J, Cheng T, et al. PubChem 2019 update: Improved access to chemical data. Nucleic Acids Res 2019; 47: D1102-D1109. [Article] [Google Scholar]
- Probst D, Reymond JL. Visualization of very large high-dimensional data sets as minimum spanning trees. J Cheminform 2020; 12: 12. [Article] [Google Scholar]
- Rogers D, Hahn M. Extended-connectivity fingerprints. J Chem Inf Model 2010; 50: 742-754. [Article] [Google Scholar]
- Gilson MK, Liu T, Baitaluk M, et al. BindingDB in 2015: A public database for medicinal chemistry, computational chemistry and systems pharmacology. Nucleic Acids Res 2016; 44: D1045-D1053. [Article] [Google Scholar]
- Mendez D, Gaulton A, Bento AP, et al. ChEMBL: Towards direct deposition of bioassay data. Nucleic Acids Res 2019; 47: D930-D940. [Article] [Google Scholar]
- Kipf TN, Welling M. Semi-supervised classification with graph convolutional networks. ArXiv:1609.02907 [Google Scholar]
- Veličković P, Cucurull G, Casanova A, et al. Graph attention networks. ArXiv:1710.10903 [Google Scholar]
- Gilmer J, Schoenholz SS, Riley PF, et al. Neural message passing for quantum chemistry. In: Proceedings of the 34th International Conference on Machine Learning. PMLR, 2017, 1263–1272 [Google Scholar]
- Daina A, Michielin O, Zoete V. SwissADME: A free web tool to evaluate pharmacokinetics, drug-likeness and medicinal chemistry friendliness of small molecules. Sci Rep 2017; 7: 42717. [Article] [Google Scholar]
- Yokoyama U, Iwatsubo K, Umemura M, et al. The prostanoid EP4 receptor and its signaling pathway. Pharmacol Rev 2013; 65: 1010-1052. [Article] [Google Scholar]
- Fan F, Binkowski BF, Butler BL, et al. Novel genetically encoded biosensors using firefly luciferase. ACS Chem Biol 2008; 3: 346-351. [Article] [Google Scholar]
- Toyoda Y, Morimoto K, Suno R, et al. Ligand binding to human prostaglandin E receptor EP4 at the lipid-bilayer interface. Nat Chem Biol 2019; 15: 18-26. [Article] [Google Scholar]
- Cilenti F, Barbiera G, Caronni N, et al. A PGE2-MEF2A axis enables context-dependent control of inflammatory gene expression. Immunity 2021; 54: 1665-1682.e14. [Article] [Google Scholar]
- Na YR, Jung D, Stakenborg M, et al. Prostaglandin E2 receptor PTGER4-expressing macrophages promote intestinal epithelial barrier regeneration upon inflammation. Gut 2021; 70: 2249-2260. [Article] [Google Scholar]
- Gunassekaran GR, Poongkavithai Vadevoo SM, Baek MC, et al. M1 macrophage exosomes engineered to foster M1 polarization and target the IL-4 receptor inhibit tumor growth by reprogramming tumor-associated macrophages into M1-like macrophages. Biomaterials 2021; 278: 121137. [Article] [Google Scholar]
- Wu Y, Yang S, Ma J, et al. Spatiotemporal immune landscape of colorectal cancer liver metastasis at single-cell level. Cancer Discov 2022; 12: 134-153. [Article] [Google Scholar]
- Gonda TA, Fang J, Salas M, et al. A DNA hypomethylating drug alters the tumor microenvironment and improves the effectiveness of immune checkpoint inhibitors in a mouse model of pancreatic cancer. Cancer Res 2020; 80: 4754-4767. [Article] [Google Scholar]
- Molgora M, Esaulova E, Vermi W, et al. TREM2 modulation remodels the tumor myeloid landscape enhancing anti-PD-1 immunotherapy. Cell 2020; 182: 886-900.e17. [Article] [Google Scholar]
- Ghorbani M, Gendelev L, Beroza P, et al. Autoregressive fragment-based diffusion for pocket-aware ligand design. ArXiv:2401.05370 [Google Scholar]
- Zhang O, Zhang J, Jin J, et al. ResGen is a pocket-aware 3D molecular generation model based on parallel multiscale modelling. Nat Mach Intell 2023; 5: 1020-1030. [Article] [Google Scholar]
- Chan L, Kumar R, Verdonk M, et al. A multilevel generative framework with hierarchical self-contrasting for bias control and transparency in structure-based ligand design. Nat Mach Intell 2022; 4: 1130-1142. [Article] [Google Scholar]
- Campbell Q, Cox S, Medina J, et al. MDCrow: Automating molecular dynamics workflows with large language models. ArXiv:2502.09565 [Google Scholar]
- Wang J, Hsieh CY, Wang M, et al. Multi-constraint molecular generation based on conditional transformer, knowledge distillation and reinforcement learning. Nat Mach Intell 2021; 3: 914-922. [Article] [Google Scholar]
- Yu J, Zheng Y, Koh HY, et al. Collaborative expert LLMs guided multi-objective molecular optimization. ArXiv:2503.03503 [Google Scholar]
All Figures
|
Figure 1 Establishment of the image-guided antagonist discovery workflow. (A) Illustration of the virtual compound library generator process: known active molecules are fragmented into scaffolds and molecular fragments, which are then reassembled using a deep learning model (decorator) to generate diverse and novel molecules. These molecules form the virtual compound library for further screening. (B) The construction process of the screening model: the EP4 activity dataset was used to finetune the property prediction model, ImageMol, which had been pre-trained on a large-scale self-supervised dataset. This resulted in a predictor capable of determining whether a molecule is active. (C) Thumbnails of virtual filters: From top to bottom, the steps and corresponding changes in the number of compounds during the process of screening the final hit compounds from the large-scale generated dataset are shown. (D) Description of the process for further manual screening, chemical synthesis, and biological verification: the top 50 compounds identified by the screening model were selected for these subsequent steps. |
| In the text | |
|
Figure 2 The performance of LeadDisFlow. (A) The performance of various screening models in classifying EP4 activity. (B) t-SNE plotted the chemical space of 3000 randomly selected generated molecules (blue) and EP4 compounds (orange). (C) Local of the final selected compounds images whose structures are highlighted by Grad-CAM. The warmer the colour, the more attention of the area, and these regions exert a greater influence on molecular activity. The colder the colour, the less attention of the area, and these regions have a lesser influence on molecular activity. (D) The comparative performance of graph-based and image-based methods in the task of activity cliff identification. |
| In the text | |
|
Figure 3 The synthetic route of ZY001–ZY004. Reagents and conditions: (a) S, ethyl cyanoacetate, morpholine, EtOH, 60 °C, 9 h; (b) tert-butyl nitrite, CuBr2, MeCN, 1,4-dioxane, 0 °C to room temperature (rt), 5 h; (c) benzaldehyde derivatives, n-BuLi, Et2O, −78 °C to rt, 6 h; (d) TFA, Et3SiH, DCM, 0 °C, 2 h; (e) LiOH·H2O, THF/MeOH/H2O = 2:2:1, 45 °C, 2 h; (f) methyl-4-[(1S)-1-aminoethyl]benzo-ate, HATU, DIPEA, DMF, rt, 6 h. |
| In the text | |
|
Figure 4 Experimental confirmation of ZY001–ZY004 as highly potent EP4 antagonists. (A–D) Dose-response curves of ZY001 (A), ZY002 (B), ZY003 (C), and ZY004 (D) against EP4 in GloSensor cAMP assay, respectively (n = 3). (E) Dose-response curves of ZY001 against EP4 in CRE reporter assay (n = 3). (F) Dose-response curves of ZY001 against EP1 in NFAT reporter assay (n = 3). (G, H) Dose-response curves of ZY001 against EP2 (G) and EP3 (H) in CRE reporter assay (n = 3). (I) Schild plot analyses of ZY001 in the GloSensor cAMP assay. (J) The pA2 and slope of this Schild plot (I) were 8.596 and 1.014, respectively. (K) Schild plot analyses of ZY003 in the GloSensor cAMP assay. (L) The pA2 and slope of this Schild plot (K) were 8.239 and 0.985, respectively. Data were shown as the mean ± SEM. |
| In the text | |
|
Figure 5 Predicted binding model of ZY001 to EP4 receptor. Green dashed lines indicate hydrogen bonding interactions, grey dashed lines indicate hydrophobic interactions, and the dashed yellow line shows the salt bridge. |
| In the text | |
|
Figure 6 ZY001 inhibited the expression of immunosuppressive molecules in Raw 264.7 cells. Mouse Raw 264.7 macrophages were treated with E7046 (10 μM) or ZY001 (0.1, 1, 10 μM) in the existence of PGE2 (40 nM) for 24 h. The mRNA expression of Il4 (A), Mrc1 (B), Chil3 (C), Trem2 (D) and Ptgs2 (E) were determined by Q-PCR. Gapdh was used as a reference gene. Data were shown as the mean ± SEM. One-way ANOVA followed by Tukey’s post hoc tests were performed; *P < 0.05; **P < 0.01; ***P < 0.001; and ****P < 0.0001. |
| In the text | |
Current usage metrics show cumulative count of Article Views (full-text article views including HTML views, PDF and ePub downloads, according to the available data) and Abstracts Views on Vision4Press platform.
Data correspond to usage on the plateform after 2015. The current usage metrics is available 48-96 hours after online publication and is updated daily on week days.
Initial download of the metrics may take a while.