| Issue |
Natl Sci Open
Volume 4, Number 4, 2025
|
|
|---|---|---|
| Article Number | 20240050 | |
| Number of page(s) | 17 | |
| Section | Earth and Environmental Sciences | |
| DOI | https://doi.org/10.1360/nso/20240050 | |
| Published online | 14 March 2025 | |
RESEARCH ARTICLE
Quantifying water erosion’s impact on soil productivity of croplands in China
1
Yunnan Key Laboratory of Soil Erosion Prevention and Green Development, Institute of International Rivers and Eco-Security, Yunnan University, Kunming 650500, China
2
State Key Laboratory of Earth Surface Processes and Resource Ecology, Faculty of Geographical Science, Beijing Normal University, Beijing 100875, China
3
Department of Geographic Science, Faculty of Arts and Sciences, Beijing Normal University at Zhuhai, Zhuhai 519087, China
4
Biosciences Department, Rice University, Houston, TX 77005, USA
* Corresponding authors (emails: This email address is being protected from spambots. You need JavaScript enabled to view it.
(Xingwu Duan); This email address is being protected from spambots. You need JavaScript enabled to view it.
(Baoyuan Liu))
Received:
26
September
2024
Revised:
16
January
2025
Accepted:
12
March
2025
Abstract
Soil degradation in croplands caused by water erosion significantly threatens food security. However, quantitative effects of current and future water erosion on soil productivity in croplands remain uncertain. Herein, we used 2473 soil series profiles across China to develop a quantitative method to assess the spatiotemporal characteristics of soil productivity affected by water erosion. Results showed that the productivity of 90.5% of typical soil series in China notably decreased due to water erosion. The current annual variation rate in soil productivity due to water erosion averages 10%, with a maximum of up to 33%. The Northeast Black Soil area, the Loess Plateau, and the Southwest Red Soil mountainous area face the highest risk of soil productivity degradation due to future water erosion. These high-risk regions coincide with China’s demographic dividing line (Hu Line). This study highlights the urgent need for targeted soil conservation strategies in these high-risk regions to prevent soil productivity loss and ensure sustainable agricultural practices.
Key words: soil productivity degradation / water erosion / cropland / quantitative assessment
© The Author(s) 2025. Published by Science Press and EDP Sciences.
 This is an Open Access article distributed under the terms of the Creative Commons Attribution License (https://creativecommons.org/licenses/by/4.0), which permits unrestricted use, distribution, and reproduction in any medium, provided the original work is properly cited.
INTRODUCTION
Soil productivity, defined as the capacity of soil to produce particular plants or sequences under a specified management system, has consistently been a focus of research [1,2]. Soil erosion is a major global ecological and environmental issue that impacts soil productivity, food security, and ecosystem viability [3–5]. Amid global climate change and increasing human activities, water erosion (a major type of soil erosion) seriously threatens the achievement of several targets set by the United Nations (UN) Sustainable Development Goals [6,7]. Water erosion is a major environmental problem among various land degradation processes and is directly linked to reduced food production. An estimated 3.4 million km2 of arable land worldwide (about 24%) suffers from severe erosion, leading to a decline of 33.7 million tons in global food production, and economic losses amounting to approximately 8 billion US dollars of GDP [8]. The degradation of cropland soil productivity due to water erosion poses a profound challenge to global agricultural sustainability and economic stability.
Although there is no clear global consensus on the impact of soil erosion on productivity, it is evident that soil erosion adversely affects yields of major crops such as maize and wheat. For instance, Carr et al. [9] estimated that water erosion reduces the annual global production of maize by 8.9 million tons and wheat by 5.6 million tons. Given the historical and current rates of soil erosion and its impact on the production of maize and other crops, countries such as the United States, Brazil, India, and especially China in addition to areas in sub-Saharan Africa, Europe, and Asia, have extensive vulnerable regions and are the focus of research [10–12].
Despite previous studies linking water erosion directly to reduced productivity, the magnitude of its impact on soil productivity remains poorly quantified across large agricultural regions owing to various reasons [9,13]. The primary reason is that results are often influenced by the methodology used, thus the findings are only relative. Generally, research methods are categorized into experimental and simulation methods. Experimental methods, such as topsoil cutting or addition, plot control, and soil profile simulation, are simple and practical but require controlled conditions and long observation periods, leading to significant variability [14–16]. Simulation models such as the erosion-productivity impact calculator (EPIC, later renamed the environmental policy integrated climate model) [17] and the productivity index (PI) model provide a broader understanding of soil erosion and its impacts, as they can incorporate a wide range of variables and scenarios. However, the complex structure of different models and their extensive data requirements introduce considerable uncertainties [18,19]. In addition, while Universal Soil Loss Equation (USLE)-type models offer a compromise for broad regional applications, accurately and quantitatively assessing erosion rates remains a substantial challenge owing to their dependence on data quality and resolution [20]. Therefore, accurate assessments and early warning systems for changes in soil productivity due to erosion are crucial for sustainable agriculture and effective policy formulation.
China is the world’s second most populous country and a major agricultural nation. Although it has only 8% of the world’s arable land, China produces roughly 95% of the food for approximately 20% of the global population [21]. In addition, China is a mountainous country with 20% of its arable land consisting of sloping fields, making it highly susceptible to soil erosion [22,23]. According to the Comprehensive Agricultural Zoning of China, the majority of the nine zones have extensive distributions of sloping farmland [24]. Given the intense pressure of soil erosion on China’s limited arable land, assessing the long-term impacts of soil loss on productivity is critical to sustaining crop yields and securing food supplies. To better understand the long-term risks of soil productivity degradation from future erosions in China, it is crucial to establish an early warning framework based on existing research.
We used 2473 typical soil profiles from China’s Second National Soil Survey to develop an early warning framework for soil productivity degradation by coupling the modified PI model with the soil’s vulnerability to erosion (V) and soil erosion rate (SE). This study aims to: (1) quantitatively assess the impact of past erosion and predict effects of future erosion on soil productivity in China; (2) identify key impact regions and propose targeted protection strategies. These findings will provide fundamental scientific insights for researchers and policymakers, establishing a basis for developing strategies to safeguard soil productivity and prevent erosion-related degradation in various agricultural regions.
MATERIALS AND METHODS
Study area
China, located in East Asia, is a vast and mountainous country, with 33.3% of its land area comprising mountains. China’s total cropland area was approximately 141 million hectares in 2000 [25], making it one of the largest agricultural producers in the world. The topography of China, characterized by high terrain in the west and low terrain in the east, along with its complex and diverse landforms, has led to the formation of extensive sloping farmlands [24]. In China, soil erosion with a soil loss rate greater than 25 t ha−1 yr−1 primarily occurs on sloping farmland. The average soil erosion rate was 5 t ha−1 yr−1 in China in 2011, and was 18.2 t ha−1 yr−1 for sloped, cultivated cropland [26].
China has a diversity of soil types. The basic conditions of each region in the study area are shown in Table S1.
Methods
Soil productivity
Given the importance of soil physicochemical indicators in crop production across different regions in China and the availability of corresponding data, this study used the Modified PI revised by Duan et al. [27]. The specific form of the model is as follows:
 (1)
(1)
where A, D, O, and CL represent the sufficiency of the available water capacity (AWC), soil pH, soil organic matter content and soil clay content (particle size <0.002 mm), respectively. WF represents the weight distribution function of plant roots across soil layers; i is the order number of the soil layers. Further information about the PI model, as well as detailed calculation equations for A, D, O, CL, and WF can be found in the Supplementary Information.
PI values of 0–0.2, 0.2–0.4, 0.4–0.6, 0.6–0.8, and 0.8–1 correspond to the lowest, low, medium, higher, and highest soil productivity levels, respectively [28].
A PI calculator was developed for this study to address the problem of lengthy computational times due to the large volume of data required for large-scale studies. The underlying code of this PI calculator w written in C, while the front end was implemented using C# (Figure S1).
Soil erosion rate
The basic form of the Chinese soil loss equation (CSLE) is [26]
 (2)
(2)
where SE represents the average soil loss per unit area over time and space, measured in tons per hectare per year, t ha−1 yr−1; R is the rainfall erosivity factor, measured in MJ mm ha−1 h−1 yr−1; K is the soil erodibility factor, measured in t hm2 h hm−2 MJ−1 mm, L is the slope length factor (dimensionless); S is the slope steepness factor (dimensionless); B is the vegetation cover factor of biological practices for trees, shrubs, and grasslands (dimensionless); E is the engineering measures factor (dimensionless); and T is the tillage practice factor (dimensionless). Detailed calculation methods for each of these factors are provided in the Supplementary Information (Section Soil erosion rate, Tables S2 and S3). The standards for erosion classification were set according to the Ministry of Water Resources publication SL190-2007 (Table S4).
Indicators of soil vulnerability to erosion and soil productivity reduce rate
The soil’s vulnerability to erosion, V, is the reduction in the PI due to the erosion of a unit thickness (1 cm) of soil [1]. Assuming that PI varies linearly with increasing erosion thickness, the value of V is the rate of change of the PI with increasing erosion thickness. V can be expressed as the following equation:
 (3)
(3)
where ∆PI is the amount of change in the PI after the erosion of a soil layer d-cm thick, d is the erosion thickness (cm), and V is the vulnerability to erosion (cm−1).
Linear regressioanalysis was used to examine the relationship between erosion depth and PI, from which soil vulnerability curves were derived (Figure S2).
The soil productivity reduction rate, R (%), was defined as
 (4)
(4)
where PI0 is the current soil productivity index.
Early warning of soil productivity degradation
The soil erosion modulus calculated for each region was converted into an average soil loss thickness based on local soil bulk density. Using the average soil loss thickness and current soil productivity, we projected soil productivity changes for the next 20, 50, 100, and 200 years.
The analytic hierarchy process (AHP) was used to assign weights to the three primary indicators (PI, V, and SE) critical for assessing the impact of water erosion on soil productivity. The validity of this approach is confirmed through consistency checks of the AHP weight assignments. For detailed procedures, see Table S5.
PI, V, and SE were Min-max normalized: PInorm, Vnorm, and SEnorm (detailed calculation equations can be found in the Supplementary Information). The weighted sums of these normalized indicators were calculated using the AHP-derived weights to compute the degradation risk level (DRL):
 (5)
(5)
where DRLt represents the degradation risk level of soil profile t (dimensionless); PInorm,t, Vnorm,t, and SEnorm,t represent the normalized values of PI, V, and SE (dimensionless).
DRL values were classified according to the natural breakpoint method. Considering that profiles with values greater than 0.8 were too few, the final classification was set as follows: DRL values of 0–0.2, 0.2–0.4, 0.4–0.6, and 0.6–1 correspond to levels I, II, III, and IV, respectively.
Data source
The soil data used in this study were derived from China’s Second National Soil Survey [29–35]. This study used a total of 2473 soil profiles, which included information on soil texture, pH, and organic matter content.
The analyses used in this study are based on the “Comprehensive Agricultural Zoning of China” model compiled by the National Agricultural Zoning Committee.
Data for calculating soil erosion can be found in Table 1.
Soil erosion data
RESULTS
The spatial variation of soil erosion rates and PI in China
The average soil loss across China was 5.25 t ha−1 yr−1 in 2020, with over 80% of the national land experiencing slight erosion. Spatially, three regions exhibited higher soil loss area ratios than others: the Sichuan Basin and surrounding regions (SBR) with an average erosion rate of 11.27 t ha−1 yr−1, the Yunnan-Guizhou Plateau (YGP) with an average of 10.24 t ha−1 yr−1, and the Northeast China Plain (NCP) with an average of 8.39 t ha−1 yr−1 (Figure 1).
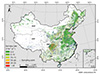 |
Figure 1 Distribution of soil loss rate and soil sampling position. China’s nine major agricultural zones are from the Resource and Environmental Science Data Platform (https://www.resdc.cn/data.aspx?DATAID=275). These Regions are the Northeast China Plain (NCP), the Northern Arid and Semiarid Region (NAR), the Huang-Huai-Hai Plain (HHP), the Loess Plateau (LP), the Qinghai-Xizang Plateau (QXP), the Middle-Lower Yangtze Plain (MYP), the Sichuan Basin and surrounding regions (SBR), Southern China (SC), and the Yunnan-Guizhou Plateau (YGP). Data for Taiwan are not available in this study. |
PI ranged from 0.0003 to 1, with an average of 0.2797. The distribution of soil productivity levels among the series was lowest (~43%), low (~32%), medium (~16%), high (6.59%), and highest (2.26%) (Figure 2a and b).
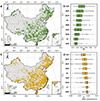 |
Figure 2 Distribution of PI (a) and V (c) in China along with PI (b) and V (d) values for soil series in different regions. See Figure 1 for abbreviations. Data for Taiwan are not available in this study. |
PI values differed significantly across different geographic regions (Figure 2a and b). On average, PI values were larger in Southwest China, Northeast China, and Southeast China. In particular, YGP (average: 0.4146) had the highest average PI while NCP (average: 0.3331) and MYP (average: 0.3052) also had high productivity levels. The region with the lowest average PI was the Huang-Huai-Hai Plain (HHP; average: 0.1592).
Change in soil productivity per unit thickness of eroded soil
The V values of the soil series ranged from −0.0404 to 0.0307, with an average of −0.0037. Approximately 9.5% of the soil series had V values greater than or equal to zero. The productivity of 90.5% of the soil series declined as erosion progressed. Notably, 7.5% of these series had V values of less than or equal to −0.01, indicating a significant and rapid decrease.
The values of V also varied significantly across different geographic regions, with a general trend of higher average PI corresponding to lower V values within regions (Figure 2c and d). YGP (average: −0.0055), NCP (average: −0.0044), and MYP in Southeast China (average: −0.0046) had low V values. By contrast, the highest average V value was observed in HHP (average: −0.0016).
Assessment of future erosion impact on soil productivity
Assuming the erosion rates remain constant, the distribution of PI over 20, 50, 100, and 200 years of water erosion was projected (Figure 3). Over time, the PI values within the study area were expected to decline significantly. The percentages of the soil series profiles with different PI values of the total samples are shown in Table S6.
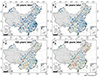 |
Figure 3 Distribution of PI after 20 years (a), 50 years (b), 100 years (c), and 200 years (d) of water erosion. See Figure 1 for abbreviation. Data for Taiwan are not available in this study. |
After 20 years, only 8% of the soil series are expected to exhibit an R-value greater than 5% (Table S7). In 50 years, 22% of the soil series are projected to lose more than 5% of their soil productivity, increasing to 41% after 100 years. After 200 years, this percentage rises to 59%, with only 12% of the soil series expected to maintain their original productivity.
Regionally, the largest decreases in soil productivity are projected in Southwest China. In 200 years, SBR will have an average R-value of 34%, YGP will have an average R-value of 31%, and NCP will have an average R-value of 26%. The soil series profiles that exhibit the greatest declines in productivity are concentrated near China’s demographic dividing line (the Hu Line).
Assessments of early warning for soil productivity degradation in the study area reveal that risk levels I, II, III, and IV account for 34%, 45%, 13%, and 8%, respectively.
For soil series profiles at risk level Ⅳ, 33% are located in NCP, 30% in YGP, 14% in SBR, and 13% in the Loess Plateau (LP). The soil series at the highest risk level tend to be distributed along the Hu Line (Figure 4). The soil series with the lowest degradation risk are predominantly found in the Northern arid and semiarid region (NAR), accounting for 25%, followed by 21% in MYP and 18% in HHP in Eastern China.
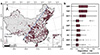 |
Figure 4 Distribution of the degradation risk level for typical soil series' profiles in China (a) and degradation risk values for typical soil series in different regions (b). See Figure 1 for abbreviations. Data for Taiwan are not available in this study. |
DISCUSSION
Potential soil productivity degradation risks in key agricultural areas in China
This study focuses on three vital agricultural areas in China: NCP, YGP, and MYP. These areas have the common characteristic of high soil productivity (high PI value) but are highly susceptible to soil erosion (low V value). Notably, soil productivity refers to the intrinsic potential of the soil to support crop growth and achieve yields, independent of external factors such as climate or management practices [1,2]. Distinct from concepts such as vegetation or agricultural productivity, high soil productivity has a potential capacity and does not directly equate to high crop yield [36,37]. As key agricultural areas in China, their grain production security is tied to the nation’s economy, livelihood, and social stability [38], highlighting both challenges and opportunities for advancing sustainable agricultural practices.
NCP is known for its fertile black soil. The black soil is classified as Udic Argiboroll in the United States Department of Agriculture (USDA) soil Taxonomy with Phaeozem parent material from quaternary loess sediments [39], fine texture, and abundant organic matter [40]. Higher soil organic matter concentrations enhance soil water retention [41] and improve soil nutrient content and overall structure [42]. These soil properties confer natural productivity, making NCP one of the highest-yielding regions in China [43]. NCP plays a crucial role in China’s food supply by producing major food crops such as corn and soybeans [44]. However, intensive cultivation has led to severe soil degradation. Long-term soil erosion has resulted in the rapid loss of surface SOM and increased soil alkalization [45]. Conservation tillage helps minimize soil disturbance, while techniques such as ridge tillage and subsoiling protect the soil surface [46]. Wide and narrow rotation planting with high stubble standing retention can contribute to maintaining soil health [47]. Micro-basin tillage has proven to be the most effective method for reducing runoff and sediment production [48]. These practices play a crucial role in preserving soil organic components, thereby ensuring agricultural productivity.
The unique karst topography in YGP has produced soils of varying textures and mineral compositions [49]. In Yunnan, for example, red soils are the most widespread zonal soil type, while the more mature soils are predominantly found in paddy fields, which hold enormous potential for food production [50]. Most plateaus are located in double-cropping regions, producing important crops such as maize and tobacco, which play a significant role in regional food security [51]. YGP has high soil productivity owing to factors such as good organic matter content and advantageous soil structure. However, the effects of soil on yield level and stability are limited, as crop production here is constrained by the complex terrain, which limits the availability of high-quality farmland with gentle slopes, and challenges large-scale mechanized farming and efficient land management [52]. In addition, YGP is mountainous with steep slopes that often experience rapid runoff and serious soil erosion [53]. Furthermore, rocky desertification is a serious issue that occurs due to soil and water loss in karst areas [54]. Intensive management in YGP is further challenged by the region’s ethnic diversity and complex terrain, making it impractical to mobilize millions of smallholder farmers to adopt management practices that simultaneously address production and pollution concerns [55]. Thus, it is crucial to prioritize biological practices, understand the cultivation intentions of ethnic minorities [56], and promote traditional ecological knowledge in sustainable land use within local minority communities. These practices can be aligned with local ecological conditions and cultural context, significantly contributing to the protection of soil integrity and health.
In MYP, human activities have a notable and systematic impact on soil characteristics and sediment transport [57]. The area primarily comprises cultivated soils, such as paddy soils, which are a type of Hydragric Anthrosol. These soils contain much higher levels of soil organic carbon and total nitrogen contents than upland soils. Intensive cultivation is crucial to forming soil texture and structure [58]. The Yangtze River Delta, a central production area for rice and wheat, predominantly practices rice-wheat rotation. Although MYP does not face severe soil erosion, urbanization and soil pollution pose significant challenges. The encroachment of urban areas on agricultural land requires effective land use planning and integrated urban-rural strategies [59]. Noteworthy issues in soil pollution include the presence of microplastics [60] and heavy metal pollution [61]. To address this pollution from industrial, agricultural, and urban sources, it is essential to implement stringent waste treatment regulations and control industrial emissions. Additionally, promoting biological-chemical remediation technologies can help mitigate these problems [62].
However, other regions in China with lower soil productivity and erodibility may not be able to compensate for the potential decline in these key agricultural areas. Therefore, sustaining agricultural practices in such areas with high soil productivity potential is a regional and national priority.
Environmental and agricultural challenges along the Hu Line
This study uncovered a crucial finding: regions at the highest risk of productivity degradation due to water erosion are closely aligned with the “Hu Huanyong Line” (or “Hu Line”), which is also recognized as China’s population density demarcation line [63]. Connecting Heihe City in the northeast and Tengchong City in the southwest, the Hu Line was initially recognized as a demographic contrast line in China with 96% of the population in the southeast and 4% in the northwest [64]. Recent research has shown that the Hu Line also demarcates differences in urbanization, landscape, civilization, and the ecological effects of land use changes [65]. Its formation and development are closely linked to natural conditions such as topography, geomorphology, climate, and hydrology, in addition to social, economic, and human activities.
The Hu Line typically marks a transitional zone between eastern and western China, both ecologically and socioeconomically, resulting in a complex and environmentally fragile region. This line traverses mountainous and hilly areas characterized by complex ecosystems primarily shaped by the terrain [66,67]. Coupled with natural factors such as rainfall patterns and significant differences in human activities on either side of the line, the area near the Hu Line experiences high rates of soil and water loss [68]. Therefore, regions along the Hu Line are at high risk of soil productivity degradation, impacting productivity and environmental sustainability. By focusing conservation efforts along this demographic boundary, China can more effectively safeguard its vital agricultural resources and ensure long-term ecological and economic stability (Figure 5).
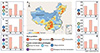 |
Figure 5 Current status, causes, and future conservation strategies for soil productivity degradation across various geographic regions. (a) The degradation risk within different regions of China was generated using kriging interpolation based on the results from Section 3.3. The relative levels of PI, V, and SE (normalized), the primary cause of degradation, and future conservation measures in Northwest China (b), the Sichuan Basin and surrounding regions (c), the Yunnan-Guizhou Plateau (d), the Northeast China Plain (e), the Loess Plateau (f), and Eastern China (g). Data for Taiwan are not available in this study. |
The Hu Line passes through NCP, LP, SBR, and YGP. NCP and YGP share similarities, both exhibiting high levels of PI and V. LP and SBR display mid-range PI and V levels. However, these regions are also at high risk of degradation, primarily due to the high erosion rates along the line.
LP is situated to the north and east of the Hu Line, primarily in the upper and middle reaches of the Yellow River. LP is a vast area of continuous thick loess deposits spanning approximately 440,000 km2 [69]. Loess is loose, porous, homogeneous, easy to cultivate, and highly erodible [70]. As one of the most severely eroded areas globally, Holocene soil erosion rates here are primarily influenced by climate change and vegetation cover, with dense human activity as a major driver of changes in soil erosion [71,72]. Over the past decades, the central government has initiated the large-scale Grain-for-Green Project on LP to control soil and water loss. Through vegetation restoration and ecological construction, which are proven effective by numerous studies, the LP region has achieved soil erosion control [73–75]. In the future, efforts in LP should focus on high ground cover vegetation to control soil and water loss along with prioritizing species that require less water and minimal thinning [76].
SBR features diverse soil types, with characteristic purple soil, classified as Regosol in the Food and Agriculture Organization of the UN classification or Entisol in the USDA Taxonomy. Purple soil occurs in the early stages of soil formation, is rich in phosphorus and potassium, and can become fertile cultivated soil with reasonable planting and fertilization measures [77,78]. Purple soil is widely distributed in the hilly Sichuan Basin, however, it is highly vulnerable to erosion, particularly in sloped croplands. In this region, particularly around the mountainous areas, complex land use combined with steep slopes results in severe water erosion. In addition, tillage erosion is a major contributor to soil degradation and reduced crop yields [79]. Current research has identified rainfall intensity, slope, and tillage methods as key factors influencing erosion in this region. Therefore, in addition to reforestation projects, efforts in SBR should focus on tillage practices that minimize soil and water loss, which includes changing from the traditional practice of downslope tillage to tilling parallel to the contour [80].
In the areas west of the Hu Line (NAR and the Qinghai-Xizang Plateau), concerns about soil productivity degradation are low due to the sparse population and limited cultivated land. However, these regions face various environmental challenges, one of which is desertification, a major form of land degradation, which can lead to reduced livestock and crop yields, posing a threat to China’s food security. Therefore, developing plans for scientific and practical land use is crucial for achieving a balance between land use intensity and ecological carrying capacity [81].
By contrast, regions east of the Hu Line, despite having higher soil productivity, lower rates of soil and water loss, and a lower risk of land degradation, face notable challenges due to urbanization. These densely populated areas such as MYP are experiencing land encroachment and a decreasing availability of agricultural land [82]. Moreover, soil pollutants, such as heavy metals and chemical residues, are a primary concern for soil management in these areas [83].
Limitations and future improvements
This study used data from the Second National Soil Survey of China conducted between 1975 and 1994 to ensure completeness, accuracy, and consistency. However, these data are now over 30 years old, and soil conditions may have changed since then. Future research should incorporate updated soil data to produce results that more accurately reflect current conditions. Due to limitations in data availability, this study relied solely on the PI model. While the reliability of the PI model is supported by numerous studies, it is important to acknowledge that every model has its limitations [84]. Furthermore, the complex interactions among climatic, topographical, and geomorphological factors affecting soil productivity are not yet fully explored and warrant further investigation [85].
The CSLE model is an adaptation of the widely used USLE model that predicts soil erosion. Similar to the original USLE model, the CSLE model is primarily used to predict and assess average annual erosion patterns at an interannual scale rather than provide real-time forecasting or dynamic simulation. USLE-type models are empirical and static, without the dynamic feedback mechanisms required to simulate the complex processes of soil erosion in real-time. When predicting future soil productivity, we assumed constant erosion rates, even though soil erosion continues to increase despite global mitigation efforts [5]. While various models (e.g., WATEM-SEDEM, AGNPS, LISEM, PESERA, and SWAT) exist to predict soil erosion, further integration of field observations and conceptual models is necessary for their refinement [86,87].
CONCLUSIONS
In this study, we integrated 2473 soil profile samples from the Second National Soil Survey of China into our early warning framework for soil productivity. The results showed that about 90.5% typical soil series experienced substantial decreases due to water erosion, while 9.5% exhibited no negative impacts. The current annual rate of soil productivity variation due to water erosion is 10%, with a maximum reaching 33%. Over the next 200 years, 59% of the soil series are projected to lose more than 5% of their productivity due to erosion, while only 12% are expected to maintain their original productivity. The Northeast Black Soil area, the Loess Plateau, and the Southwest Red Soil mountainous area face the highest risk of soil productivity degradation due to future water erosion. Notably, these high-risk regions coincide with China’s demographic dividing line (Hu Line), emphasizing their importance for future soil conservation efforts. Overall, this study highlights the urgent need for targeted soil conservation strategies in these high-risk regions to prevent soil productivity loss and ensure sustainable agricultural practices.
Data availability
The original data are available from corresponding authors upon reasonable request.
Funding
This work was supported by the National Natural Science Foundation of China (U2002209, 42271128), the Distinguished Young Found Project of Yunnan Province (202201AV070001), the National Key R&D Program of China (2023YFD1901201), and the Yuanjiang Dry-hot Valley Water and Soil Conservation Observation and Research Station of Yunnan Province, Yunnan University.
Author contributions
X.Y.: Conceptualization, Methodology, Software, Formal analysis, Investigation, Writing – original draft, Writing – review & editing. X.D.: Conceptualization, Methodology, Validation, Writing – original draft, Writing – review & editing, Supervision, Project administration, Funding acquisition. B.L.: Writing – review & editing. Y.X.: Writing – review & editing. H.W.: Validation, Investigation, Writing – Review & Editing. E. Z.: Visualization, Writing – review & editing. L.R.: Methodology, Writing – review & editing. E.S.: Writing – review & editing. Y.L.: Visualization, Writing – review & editing. D.F.: Validation, Writing – Review & Editing. H.L.: Validation, Writing – Review & Editing.
Conflict of interest
The authors declare no conflict of interest.
Supplementary information
Supplementary file provided by the authors. Access Supplementary Material
References
- Pierce FJ, Larson WE, Dowdy RH, et al. Productivity of soils: Assessing long-term changes due to erosion. J Soil Water Conserv 1983; 38: 39-44. [Article] [Google Scholar]
- Mueller L, Schindler U, Mirschel W, et al. Assessing the productivity function of soils. A review. Agron Sustain Dev 2010; 30: 601-614. [Article] [Google Scholar]
- Cole MB, Augustin MA, Robertson MJ, et al. The science of food security. NPJ Sci Food 2018; 2: 14. [Article] [Google Scholar]
- Potapov P, Turubanova S, Hansen MC, et al. Global maps of cropland extent and change show accelerated cropland expansion in the twenty-first century. Nat Food 2022; 3: 19-28. [Article] [Google Scholar]
- Wuepper D, Borrelli P, Finger R. Countries and the global rate of soil erosion. Nat Sustain 2020; 3: 51-55. [Article] [Google Scholar]
- Borrelli P, Robinson DA, Panagos P, et al. Land use and climate change impacts on global soil erosion by water (2015–2070). Proc Natl Acad Sci USA 2020; 117: 21994-22001. [Article] [Google Scholar]
- Senanayake S, Pradhan B, Wedathanthirige H, et al. Monitoring soil erosion in support of achieving SDGs: A special focus on rainfall variation and farming systems vulnerability. Catena 2024; 234: 107537. [Article] [Google Scholar]
- Sartori M, Philippidis G, Ferrari E, et al. A linkage between the biophysical and the economic: Assessing the global market impacts of soil erosion. Land Use Policy 2019; 86: 299-312. [Article] [Google Scholar]
- Carr TW, Balkovič J, Dodds PE, et al. The impact of water erosion on global maize and wheat productivity. Agric Ecosyst Environ 2021; 322: 107655. [Article] [Google Scholar]
- Bakker MM, Govers G, Jones RA, et al. The effect of soil erosion on Europe’s crop yields. Ecosystems 2007; 10: 1209-1219. [Article] [Google Scholar]
- Bindraban PS, van der Velde M, Ye L, et al. Assessing the impact of soil degradation on food production. Curr Opin Environ Sustain 2012; 4: 478-488. [Article] [Google Scholar]
- Jang WS, Neff JC, Im Y, et al. The hidden costs of land degradation in US maize agriculture. Earths Future 2021; 9: e2020EF001641. [Article] [Google Scholar]
- Bakker MM, Govers G, Rounsevell MDA. The crop productivity-erosion relationship: An analysis based on experimental work. Catena 2004; 57: 55-76. [Article] [Google Scholar]
- Gao X, Xie Y, Liu G, et al. Effects of soil erosion on soybean yield as estimated by simulating gradually eroded soil profiles. Soil Tillage Res 2015; 145: 126-134. [Article] [Google Scholar]
- Quinton JN, Öttl LK, Fiener P. Tillage exacerbates the vulnerability of cereal crops to drought. Nat Food 2022; 3: 472-479. [Article] [Google Scholar]
- Zhang L, Huang Y, Rong L, et al. Effect of soil erosion depth on crop yield based on topsoil removal method: A meta-analysis. Agron Sustain Dev 2021; 41: 63. [Article] [Google Scholar]
- Williams JR, Jones CA, Dyke PT. A modeling approach to determining the relationship between erosion and soil productivity. Trans ASAE 1984; 27: 0129-0144. [Article] [Google Scholar]
- Carr TW, Balkovič J, Dodds PE, et al. Uncertainties, sensitivities and robustness of simulated water erosion in an EPIC-based global gridded crop model. Biogeosciences 2020; 17: 5263-5283. [Article] [Google Scholar]
- Müller C, Jägermeyr J, Franke JA, et al. Substantial differences in crop yield sensitivities between models call for functionality-based model evaluation. Earths Future 2024; 12: e2023EF003773. [Article] [Google Scholar]
- Alewell C, Ringeval B, Ballabio C, et al. Global phosphorus shortage will be aggravated by soil erosion. Nat Commun 2020; 11: 4546. [Article] [CrossRef] [PubMed] [Google Scholar]
- Huang J, Yang G. Understanding recent challenges and new food policy in China. Glob Food Security 2017; 12: 119-126. [Article] [Google Scholar]
- Fang Y, Ying B. Spatial distribution of mountainous regions and classifications of economic development in China. J Mt Sci 2016; 13: 1120-1138. [Article] [Google Scholar]
- Li H, Shi D. Spatio-temporal variation in soil erosion on sloping farmland based on the integrated valuation of ecosystem services and trade-offs model: A case study of Chongqing, southwest China. Catena 2024; 236: 107693. [Article] [Google Scholar]
- Wang Y, Hu X, Yu S, et al. Soil conservation of sloping farmland in China: History, present, and future. Earth-Sci Rev 2024; 249: 104655. [Article] [Google Scholar]
- Liu J, Liu M, Tian H, et al. Spatial and temporal patterns of China’s cropland during 1990–2000: An analysis based on Landsat TM data. Remote Sens Environ 2005; 98: 442-456. [Article] [Google Scholar]
- Liu B, Xie Y, Li Z, et al. The assessment of soil loss by water erosion in China. Int Soil Water Conserv Res 2020; 8: 430-439. [Article] [Google Scholar]
- Duan X, Xie Y, Feng Y, et al. Study on the method of soil productivity assessment in black soil region of Northeast China. Agric Sci China 2009; 8: 472-481. [Article] [Google Scholar]
- Duan X, Rong L, Zhang G, et al. Soil productivity in the Yunnan province: Spatial distribution and sustainable utilization. Soil Tillage Res 2015; 147: 10-19. [Article] [Google Scholar]
- National Soil Survey Office. Soil Species of China. Vol. 1 (in Chinese). Beijing: China Agricultural Press, 1993 [Google Scholar]
- National Soil Survey Office. Soil Species of China. Vol. 2 (in Chinese). Beijing: China Agricultural Press, 1994 [Google Scholar]
- National Soil Survey Office. Soil Species of China. Vol. 3 (in Chinese). Beijing: China Agricultural Press, 1994 [Google Scholar]
- National Soil Survey Office. Soil Species of China. Vol. 4 (in Chinese). Beijing: China Agricultural Press, 1995 [Google Scholar]
- National Soil Survey Office. Soil Species of China. Vol. 5 (in Chinese). Beijing: China Agricultural Press, 1995 [Google Scholar]
- National Soil Survey Office. Soil Species of China. Vol. 6 (in Chinese). Beijing: China Agricultural Press, 1996 [Google Scholar]
- National Soil Survey Office. Soils of China (in Chinese). Beijing: China Agricultural Press, 1998. 1–253 [Google Scholar]
- Ortiz-Bobea A, Ault TR, Carrillo CM, et al. Anthropogenic climate change has slowed global agricultural productivity growth. Nat Clim Chang 2021; 11: 306-312. [Article] [CrossRef] [Google Scholar]
- Rumpf SB, Gravey M, Brönnimann O, et al. From white to green: Snow cover loss and increased vegetation productivity in the European Alps. Science 2022; 376: 1119-1122. [Article] [Google Scholar]
- Liu Y, Zhou Y. Reflections on China’s food security and land use policy under rapid urbanization. Land Use Policy 2021; 109: 105699. [Article] [Google Scholar]
- Sun JM, Liu DS. Desertification in the Northeastern China (in Chinese). Quat Sci 2001; 21: 72–78 [Google Scholar]
- Fang HY, Sheng ML, Tang ZH, et al. Assessment of soil redistribution and spatial pattern for a small catchment in the black soil region, Northeastern China: Using fallout 210Pbex. Soil Tillage Res 2013; 133: 85-92. [Article] [Google Scholar]
- Kane DA, Bradford MA, Fuller E, et al. Soil organic matter protects US maize yields and lowers crop insurance payouts under drought. Environ Res Lett 2021; 16: 044018. [Article] [Google Scholar]
- Oldfield EE, Wood SA, Bradford MA. Direct effects of soil organic matter on productivity mirror those observed with organic amendments. Plant Soil 2018; 423: 363-373. [Article] [Google Scholar]
- Wang H, Yang S, Wang Y, et al. Rates and causes of black soil erosion in Northeast China. Catena 2022; 214: 106250. [Article] [Google Scholar]
- Liu Z, Yang X, Hubbard KG, et al. Maize potential yields and yield gaps in the changing climate of Northeast China. Glob Change Biol 2012; 18: 3441-3454. [Article] [Google Scholar]
- Ou Y, Rousseau AN, Wang L, et al. Spatio-temporal patterns of soil organic carbon and pH in relation to environmental factors—A case study of the Black Soil Region of Northeastern China. Agric Ecosyst Environ 2017; 245: 22-31. [Article] [Google Scholar]
- Wang S, Xu X, Huang L. Spatial and temporal variability of soil erosion in Northeast China from 2000 to 2020. Remote Sens 2023; 15: 225. [Article] [Google Scholar]
- Tang Q, Li S, Xie R, et al. Effects of conservation tillage on crop yield: A case study in the part of typical ecological zones in China. Agric Sci China 2011; 10: 860-866. [Article] [Google Scholar]
- Jia L, Zhao W, Zhai R, et al. Regional differences in the soil and water conservation efficiency of conservation tillage in China. Catena 2019; 175: 18-26. [Article] [Google Scholar]
- Peng X, Dai Q. Drivers of soil erosion and subsurface loss by soil leakage during karst rocky desertification in SW China. Int Soil Water Conserv Res 2022; 10: 217-227. [Article] [Google Scholar]
- Duan X, Bai Z, Rong L, et al. Investigation method for regional soil erosion based on the Chinese Soil Loss Equation and high-resolution spatial data: Case study on the mountainous Yunnan Province, China. Catena 2020; 184: 104237. [Article] [Google Scholar]
- Li H, Dai M, Dai S, et al. Current status and environment impact of direct straw return in China’s cropland—A review. Ecotox Environ Saf 2018; 159: 293-300. [Article] [Google Scholar]
- Zhao J, Yang X. Distribution of high-yield and high-yield-stability zones for maize yield potential in the main growing regions in China. Agric For Meteorol 2018; 248: 511-517. [Article] [Google Scholar]
- Xie Y, Tang J, Gao Y, et al. Spatial distribution of soil erosion and its impacts on soil productivity in Songnen typical black soil region. Int Soil Water Conserv Res 2023; 11: 649-659. [Article] [Google Scholar]
- Huang W, Ho HC, Peng Y, et al. Qualitative risk assessment of soil erosion for karst landforms in Chahe town, Southwest China: A hazard index approach. Catena 2016; 144: 184-193. [Article] [Google Scholar]
- Cui Z, Zhang H, Chen X, et al. Pursuing sustainable productivity with millions of smallholder farmers. Nature 2018; 555: 363-366. [Article] [Google Scholar]
- Li G, Zhang B. Identification of landscape character types for trans-regional integration in the Wuling Mountain multi-ethnic area of southwest China. Landscape Urban Plan 2017; 162: 25-35. [Article] [Google Scholar]
- Yang HF, Yang SL, Xu KH, et al. Human impacts on sediment in the Yangtze River: A review and new perspectives. Glob Planet Change 2018; 162: 8-17. [Article] [CrossRef] [Google Scholar]
- Wei L, Ge T, Zhu Z, et al. Comparing carbon and nitrogen stocks in paddy and upland soils: Accumulation, stabilization mechanisms, and environmental drivers. Geoderma 2021; 398: 115121. [Article] [Google Scholar]
- Kuang W, Liu J, Tian H, et al. Cropland redistribution to marginal lands undermines environmental sustainability. Natl Sci Rev 2022; 9: nwab091. [Article] [Google Scholar]
- Yuan W, Christie-Oleza JA, Xu EG, et al. Environmental fate of microplastics in the world’s third-largest river: Basin-wide investigation and microplastic community analysis. Water Res 2022; 210: 118002. [Article] [Google Scholar]
- Peng J, Zhang S, Han Y, et al. Soil heavy metal pollution of industrial legacies in China and health risk assessment. Sci Total Environ 2022; 816: 151632. [Article] [Google Scholar]
- Sun J, Pan L, Tsang DCW, et al. Organic contamination and remediation in the agricultural soils of China: A critical review. Sci Total Environ 2018; 615: 724-740. [Article] [Google Scholar]
- Hu HY. Distribution of China’s population: Accompanying charts and density map (in Chinese). Acta Geogr Sin 1935; 2: 33–74 [Google Scholar]
- Qi W, Liu S, Zhao M, et al. China’s different spatial patterns of population growth based on the “Hu Line”. J Geogr Sci 2016; 26: 1611-1625. [Article] [Google Scholar]
- Kong X, Fu M, Zhao X, et al. Ecological effects of land-use change on two sides of the Hu Huanyong Line in China. Land Use Policy 2022; 113: 105895. [Article] [Google Scholar]
- Tan Y, Chen H, Xiao W, et al. Influence of farmland marginalization in mountainous and hilly areas on land use changes at the county level. Sci Total Environ 2021; 794: 149576. [Article] [Google Scholar]
- Zhang H, Liu F, Zhang J. Using composite system index to identify China’s ecological and socio-economic transition zone. Front Plant Sci 2022; 13: 1057271. [Article] [Google Scholar]
- Guo X, Shao Q. Spatial pattern of soil erosion drivers and the contribution rate of human activities on the Loess Plateau from 2000 to 2015: A boundary line from northeast to southwest. Remote Sens 2019; 11: 2429. [Article] [Google Scholar]
- Juang CH, Dijkstra T, Wasowski J, et al. Loess geohazards research in China: Advances and challenges for mega engineering projects. Eng Geol 2019; 251: 1-10. [Article] [Google Scholar]
- Fu B, Wang S, Liu Y, et al. Hydrogeomorphic ecosystem responses to natural and anthropogenic changes in the Loess Plateau of China. Annu Rev Earth Planet Sci 2017; 45: 223-243. [Article] [Google Scholar]
- Zhao G, Mu X, Wen Z, et al. Soil erosion, conservation, and eco-environment changes in the Loess Plateau of China. Land Degrad Dev 2013; 24: 499-510. [Article] [Google Scholar]
- Zheng K, Wei JZ, Pei JY, et al. Impacts of climate change and human activities on grassland vegetation variation in the Chinese Loess Plateau. Sci Total Environ 2019; 660: 236-244. [Article] [Google Scholar]
- Jia L, Yu K, Li Z, et al. Temporal and spatial variation of rainfall erosivity in the Loess Plateau of China and its impact on sediment load. Catena 2022; 210: 105931. [Article] [Google Scholar]
- Jian S, Zhao C, Fang S, et al. Effects of different vegetation restoration on soil water storage and water balance in the Chinese Loess Plateau. Agric For Meteorol 2015; 206: 85-96. [Article] [Google Scholar]
- Zhou J, Fu B, Gao G, et al. Effects of precipitation and restoration vegetation on soil erosion in a semi-arid environment in the Loess Plateau, China. Catena 2016; 137: 1-11. [Article] [Google Scholar]
- Chen H, Zhang X, Abla M, et al. Effects of vegetation and rainfall types on surface runoff and soil erosion on steep slopes on the Loess Plateau, China. Catena 2018; 170: 141-149. [Article] [Google Scholar]
- Wei C, Ni J, Gao M, et al. Anthropic pedogenesis of purple rock fragments in Sichuan Basin, China. Catena 2006; 68: 51-58. [Article] [Google Scholar]
- Zhong S, Han Z, Du J, et al. Relationships between the lithology of purple rocks and the pedogenesis of purple soils in the Sichuan Basin, China. Sci Rep 2019; 9: 13272. [Article] [Google Scholar]
- Su ZA, Zhang JH, Nie XJ. Effect of soil erosion on soil properties and crop yields on slopes in the Sichuan basin, China. Pedosphere 2010; 20: 736-746. [Article] [Google Scholar]
- Zhang J. Assessment of tillage translocation and tillage erosion by hoeing on the steep land in hilly areas of Sichuan, China. Soil Tillage Res 2004; 75: 99-107. [Article] [Google Scholar]
- Ren Y, Zhang B, Chen X, et al. Analysis of spatial-temporal patterns and driving mechanisms of land desertification in China. Sci Total Environ 2024; 909: 168429. [Article] [Google Scholar]
- Yang Q, Li Z, Lu X, et al. A review of soil heavy metal pollution from industrial and agricultural regions in China: Pollution and risk assessment. Sci Total Environ 2018; 642: 690-700. [Article] [Google Scholar]
- Wu Y, Li X, Yu L, et al. Review of soil heavy metal pollution in China: Spatial distribution, primary sources, and remediation alternatives. Resour Conserv Recycl 2022; 181: 106261. [Article] [Google Scholar]
- Coban O, De Deyn GB, van der Ploeg M. Soil microbiota as game-changers in restoration of degraded lands. Science 2022; 375: abe0725. [Article] [Google Scholar]
- Eekhout JPC, de Vente J. Global impact of climate change on soil erosion and potential for adaptation through soil conservation. Earth-Sci Rev 2022; 226: 103921. [Article] [Google Scholar]
- Borrelli P, Robinson DA, Fleischer LR, et al. An assessment of the global impact of 21st century land use change on soil erosion. Nat Commun 2017; 8: 1-3. [Article] [CrossRef] [PubMed] [Google Scholar]
- de Vente J, Poesen J, Verstraeten G, et al. Predicting soil erosion and sediment yield at regional scales: Where do we stand?. Earth-Sci Rev 2013; 127: 16-29. [Article] [Google Scholar]
All Tables
All Figures
|
Figure 1 Distribution of soil loss rate and soil sampling position. China’s nine major agricultural zones are from the Resource and Environmental Science Data Platform (https://www.resdc.cn/data.aspx?DATAID=275). These Regions are the Northeast China Plain (NCP), the Northern Arid and Semiarid Region (NAR), the Huang-Huai-Hai Plain (HHP), the Loess Plateau (LP), the Qinghai-Xizang Plateau (QXP), the Middle-Lower Yangtze Plain (MYP), the Sichuan Basin and surrounding regions (SBR), Southern China (SC), and the Yunnan-Guizhou Plateau (YGP). Data for Taiwan are not available in this study. |
| In the text | |
|
Figure 2 Distribution of PI (a) and V (c) in China along with PI (b) and V (d) values for soil series in different regions. See Figure 1 for abbreviations. Data for Taiwan are not available in this study. |
| In the text | |
|
Figure 3 Distribution of PI after 20 years (a), 50 years (b), 100 years (c), and 200 years (d) of water erosion. See Figure 1 for abbreviation. Data for Taiwan are not available in this study. |
| In the text | |
|
Figure 4 Distribution of the degradation risk level for typical soil series' profiles in China (a) and degradation risk values for typical soil series in different regions (b). See Figure 1 for abbreviations. Data for Taiwan are not available in this study. |
| In the text | |
|
Figure 5 Current status, causes, and future conservation strategies for soil productivity degradation across various geographic regions. (a) The degradation risk within different regions of China was generated using kriging interpolation based on the results from Section 3.3. The relative levels of PI, V, and SE (normalized), the primary cause of degradation, and future conservation measures in Northwest China (b), the Sichuan Basin and surrounding regions (c), the Yunnan-Guizhou Plateau (d), the Northeast China Plain (e), the Loess Plateau (f), and Eastern China (g). Data for Taiwan are not available in this study. |
| In the text | |
Current usage metrics show cumulative count of Article Views (full-text article views including HTML views, PDF and ePub downloads, according to the available data) and Abstracts Views on Vision4Press platform.
Data correspond to usage on the plateform after 2015. The current usage metrics is available 48-96 hours after online publication and is updated daily on week days.
Initial download of the metrics may take a while.