| Issue |
Natl Sci Open
Volume 4, Number 4, 2025
|
|
|---|---|---|
| Article Number | 20240054 | |
| Number of page(s) | 16 | |
| Section | Earth and Environmental Sciences | |
| DOI | https://doi.org/10.1360/nso/20240054 | |
| Published online | 29 May 2025 | |
RESEARCH ARTICLE
Air particles from 31 Chinese cities induced differential cellular responses
1
State Key Joint Laboratory of Environmental Simulation and Pollution Control, College of Environmental Sciences and Engineering, Peking University, Beijing 100871, China
2
Institute of Environment & Health, Inner Mongolia Normal University, Hohhot 010022, China
* Corresponding author (email: This email address is being protected from spambots. You need JavaScript enabled to view it.
)
† Present address: Fielding School of Public Health, University of California, Los Angeles, Los Angeles, CA 90095, USA
Received:
7
October
2024
Revised:
13
February
2025
Accepted:
28
May
2025
Abstract
Current understanding of ambient particulate matter (PM) health effects is restricted by their sources, time periods, and component differences. Here, an eukaryote model organism Saccharomyces cerevisiae was used to study the differing cell level responses when exposed to 465 air samples collected from 31 Chinese cities across major latitudes. Results from cell-released volatile organic compounds (VOCs), transcriptome, and proteome showed large variations in responses of the cells with the exposure. Gene and protein expression of S. cerevisiae with 3 h PM exposure were mainly enriched in varying metabolism pathways. The genes significantly associated with VOCs are mostly enriched in six major KEGG groups, including cellular processes, genetic information processing, human diseases, metabolism, and organismal systems. Different PM components, including microbial, metal elements and organic compounds, are important players in the differences. This work also revealed the potential VOCs biomarkers for real-time monitoring of PM-induced health effects in vivo.
Key words: Saccharomyces cerevisiae / VOC / ambient particulate matter (PM) / biomarker
© The Author(s) 2025. Published by Science Press and EDP Sciences.
 This is an Open Access article distributed under the terms of the Creative Commons Attribution License (https://creativecommons.org/licenses/by/4.0), which permits unrestricted use, distribution, and reproduction in any medium, provided the original work is properly cited.
INTRODUCTION
According to the State of Global Air Report 2024, air pollution is listed as the second leading risk factor for death, which accounts for 8.1 million deaths globally in 2021 [1]. It is estimated that ambient fine particulate matter (PM2.5) accounted for 4.7 million deaths globally in 2021 [1]. PM exposure has been considered to be associated with adverse health effects such as atherosclerosis, neurodegenerative disease and alopecia [2–4]. PM is a heterogeneous mixture that differs greatly in components among different regions [5]. More and more studies have shown that PM health effects vary greatly among different regions [5–7]. However, the differences in health effects caused by PM from different regions and the response of living systems to PM exposure from different regions have not been fully elucidated. Due to limited resources both at home and abroad, most studies were conducted based on PM samples from limited sources and time periods. Accordingly, the corresponding results are limited to a couple of cities, failing to represent PM samples from large temporal and spatial scales. In addition, the health effects of ambient PM exposure have been mainly investigated through epidemiological [8–10] and toxicological methods based on animal and cell experiments [11–13]. However, epidemiological approaches based on data analysis lack direct biological evidence. Results from animal and cell experiments cannot be well applied to humans. Epidemiological and off-line toxicological approaches cannot provide timely information on the PM health effects. These difficulties hindered a thorough understanding of PM’ health effects on human particularly in a time-resolved manner.
Exhaled air analysis has become a very promising method because of its non-invasive characteristics which has great potential to directly detect the PM health effects on humans. A recent study explored that air pollution can affect the exhaled volatile organic compounds (VOCs) profiles of humans which vary among different air pollution episodes [14]. Another study found that when rats were exposed to PM samples from 31 major Chinese cities, their exhaled VOCs profiles changed differently [15]. Some VOCs were considered to have the potential to link early signs of diseases or adverse health effects [15]. These studies open up the possibility of using exhaled VOCs to monitor air toxicity in real-time. However, these studies were based on complex biological systems, and it is difficult to elucidate the physiological mechanism of VOCs changes after different PM exposures. Cell experiments can help in filling the gap. Currently, human cells are commonly used to analyze the PM health effects. However, in vitro experiments based on human cells cannot fully reflect the response of the whole organism. As an eukaryote model organism, Saccharomyces cerevisiae is considered to be an ideal cell for toxicological studies [16] and has been widely used in toxicity studies about environmental pollutants [17–19]. Many scientists have made contributions to the cell cycle, telomere protection, autophagy, DNA damage response and cancer based using the S. cerevisiae model [20–23]. The genome of common species such as S. cerevisiae S288c has been completely sequenced [24]. Many physiological mechanisms of S. cerevisiae are similar to those of higher organisms, and about 31% of protein-coding genes have high homology with humans [25]. Genes of S. cerevisiae also have high homology with many human disease genes [25]. To better understand the process of PM causing health effects, this study used S. cerevisiae S288c for exposure experiments to explore the PM health effects.
Here, PM samples from 31 major Chinese cities were collected through automobile air conditioning (AC) filters. Eukaryotic model organism S. cerevisiae cells were exposed to PM samples from 31 major Chinese cities to explore the following questions: (1) What are the effects of exposure to different PM samples on VOCs released from yeast cells? Can VOCs be used to distinguish the effects of exposure to different PM samples? (2) What are the effects of exposure to different PM samples on gene and protein expressions in yeast cell? (3) What health effects do the VOCs changes represent? What are the mechanisms of VOCs changes? (4) Which components are associated with changes in different Encyclopedia of Genes and Genomes (KEGG) pathways when S. cerevisiae cells were exposed to 31 cities’ PM samples? This study helps to elucidate the differences in health effects of exposure to PM samples from different cities from the cell level. In addition, it helps in exploring whether VOCs from cells can be used as biomarker for in vivo monitoring of PM toxicity. The results provide a comprehensive understanding of different health impacts by PMs from a large number of different urban cities.
MATERIALS AND METHODS
PM sample collection and pretreatment
Fifteen AC filters were collected from each of 31 major cities in China from December 2020 to April 2021, for a total of 465 AC filters. The selection criteria were only filters from gasoline cars, preferably from taxis. All of the AC filters were collected from December, 2020 to April, 2021. The replacement time of AC filters varies, e.g., several months, a year, or even longer. Nonetheless, we had at least 15 AC filters for each city in order to minimize the impacts of filter sample variations. Different from traditional sampling methods such as membrane sampling, as the car travels in the city, the particles trapped on the automobile air conditioning (AC) filters cover a larger time and regional scale. The collection and pretreatment methods to obtain PM samples based on AC filters were described in the previous study [5]. PM in each AC filter was shaken onto a new office paper and transferred into a sterile centrifugal tube. The mass of centrifuge tubes before (M0) and after (M) PM transfer was weighed in an analytical balance (AL204-IC, Mettler Toledo, Inc., Greifensee, Switzerland). The mass difference (M − M0) was the mass of PM. Deionized (DI) water was added into the centrifuge tubes that contained PM to obtain PM suspensions (10 mg/mL). The PM suspensions were further treated by vigorous vortexing (Vortex genie-2, Scientific Industries Co., Ltd., NY, USA) (15 min at 2800r/min). PM suspensions from each city (15 AC filters) were further mixed in equal amounts and stored at −20°C for subsequent yeast exposure experiments. Three new AC filters were also treated in the same method as a control. After the shaking, there were no visible particles on the office paper to the naked eye. 20 mL of DI water was added into the centrifuge tube for the three new AC filters each and equal volumes were mixed as a control.
Yeast cells and treatment
Here, the model strain S. cerevisiae S288c was utilized, and its genome has been completely sequenced [24]. Synthesis Complete medium (SC) was used for the culture of S. cerevisiae. The formulation and preparation methods adopted are shown in Table S5. S. cerevisiae was cultured (30°C, 200 r/min) on an orbital shaker (Chunlan Experimental Instrument Factory, Jiangsu, China) in a sterile ventilated conical flask (1000 mL, Nalgene, Thermo Fisher Scientific, Inc., CA, USA). In order to avoid the influence of metabolites produced in the expanded culture stage of yeast on the subsequent VOC determination, SC medium was used for cleaning. The yeast cells in the log phase growth stage were added into 50 mL sterile centrifuge tube (Corning® Premium Quality, Acton, USA), centrifuged at 5000 r/min for 5 min, and then the supernatant was discarded. The shock was uniform after the addition of 50 mL SC medium by using Vortex genie-2. In order to ensure that the total numbers of yeast in different groups were consistent, all the cleaned yeast solutions were counted through a hemocytometer, and then diluted or concentrated to 5 × 10⁷ cell/mL. According to the Handbook of Exposure Parameters for Chinese Population (Adult volume) [26], the average daily respiratory volume of adults is 16.1 m3/d. Therefore, when PM10 concentration is 150 μg/m3 (the 24-h average concentration standard of PM10 in residential areas in China is 150 μg/m3 [27]), the inhalation amount of adults in half an hour is about 50 μg. Therefore, 50 μg PM samples were exposed to yeast cells per milliliter. Four different experiments for 31 cities each were carried out with and without PM suspension in 50 μg/mL: (1) Group A: 100 μL PM suspensions (10 mg/mL) from 31 cities in China were added to sterile yeast exposure bottles which contain 20 mL SC (5 × 10⁷ cells/mL). The final PM exposure concentration was 50 μg PM per mL SC; (2) Group B: 100 μL control sample prepared (new AC filters) was added to the sterile yeast exposure bottles containing 20 mL SC (5 × 10⁷ cell/mL); (3) Group C: 100 μL PM suspensions (10 mg/mL) from 31 cities in China were added to sterile yeast exposure bottles containing 20 mL SC; (4) Group D: 100 μL control sample prepared (new AC filters) was added to the sterile yeast exposure bottles containing 20 mL SC. And three parallel experiments were set for a total of 192 (Group A: 31 × 3, Group B: 1 × 3, Group C: 31 × 3, Group D: 1 × 3) experiments.
VOC sampling and analysis
In order to provide aerobic environment for yeast and serve as the carrier gas during measurement, synthetic air (79% N2, 21% O2) (Chengdu Jinghao Chemical Products Co., LTD., Beijing, China) was used to inflate the yeast exposure bottle at a flow rate of 0.3 L/min, and then VOCs were continuously detected by using BreathSpec GC-IMS (G.A.S., Dortmund, Germany) which consists of a gas chromatograph (GC) and an ion mobility spectrometer (IMS) following the procedure as previously reported [28]. VOCs peak area was measured through VOCal software with a GC-IMS library (v 0.1.1, G.A.S.). VOCs contents were determined based on peak volumes. 96 kinds of VOC peak areas were detected based on drift time (Dt) values and retention index (RI) (Table S6). During the testing process, the exposed bottles were placed in the 30°C water bath to maintain the normal metabolism of yeast, and were placed in an orbital shaker (30 °C, 200 r/min) for culture during the remaining time. VOCs were measured at 0, 1, 2, 3, 4, 5, and 6 h exposure to PM from Beijing, Shanghai and Guangzhou, and at 3 h exposure to PM from 31 Chinese cities. After exposure, the yeast inoculums were counted using a hemocytometer.
Transcriptome
After 3 h exposure to PM, the total RNA of yeast cells in each yeast inoculum from different exposure groups was extracted and purified using the Plant RNA Extraction Mini Kit (Foshan Onrew Biotechnology Co., Ltd., Foshan, China) according to the manufacturer’s instructions. The entire mRNAseq library was generated using the ALFA-SEQ Directional RNaLib Prep Kit (Shenzhen Chipscreen Biosciences Co., Ltd., Shenzhen, China) according to the manufacturer’s recommendations. The clustering of the index-coded samples was conducted on a cBot Cluster Generation System (Illumina, Inc., CA, USA). And the library was then sequenced on an Illumina Novaseq 6000 platform (Illumina Inc., CA, USA) and 150 bp paired-end reads were generated.
Tandem mass tag (TMT)-labeled quantitative proteomic analysis
Due to analysis cost, 5 representative cities’ samples from different latitudes (the latitudes from high to low: Harbin, Beijing, Xi’an, Nanjing, Guangzhou) were selected for proteomic analysis. After 3 h exposure to PM, the total protein of yeast cells in each yeast inoculum from different exposure groups was extracted using a urea lysis buffer (8 mol/L urea and 1% sodium dodecyl sulfate) with a protease inhibitor. Protein concentrations were determined using a bicinchoninic acid (BCA) Protein Assay Kit (Thermo Fisher Scientific Inc., CA, USA). 100 μg of protein was taken and triethylammonium bicarbonate was added with a final concentration of 100 mmol/L. One tube of TMT reagent (Thermo Fisher Scientific Inc., CA, USA) was added for 100 μg polypeptide each. High pH reverse phase separation was performed to fractionate samples to increase the proteomic depth by using ACQUITY UPLC BEH C18 Column (1.7 μm particles, 2.1 mm ID, 150 mm length) (Waters Co., MA, USA). Two-dimensional analysis was conducted by using liquid chromatography tandem mass spectrometry (Evosep One (Evosep, Odense, Denmark) combined with Orbitrap Exploris 480 (Thermo Fisher Scientific Inc., CA, USA)) according to the standard protocols by Majorbio Bio-Pharm Technology Co. Ltd. (Shanghai, China). The RAW data files were analyzed by using Proteome Discoverer Version 2.4 (Thermo Fisher Scientific Inc., CA, USA) against the NCBInr database. The false discovery rate (FDR) of peptide identification was set as FDR ≤ 0.01.
Statistical analysis
The fold change (FC) and fold change normalized by yeast cell’s concentration (NFC) of VOCs were calculated by eqs. (1) and (2), respectively. VOCGroup A, VOCGroup B, VOCGroup C, and VOCGroup D represent the level of VOCs in the headspace of yeast in the four different experiment groups mentioned above (Group A, B, C, and D), respectively. CGroup A and CGroup B represent the average concentrations of yeast cells in the three parallel experiments from Group A and B, respectively. If the data follows a normal distribution (Shapiro-Wilk test), a paired t-test was employed to compare the differences between the numerator and the denominator of eq. (1) or (3) which represent the difference in VOC levels between experiment and control groups, otherwise Wilcoxon signed-rank test was used. If the data follows a normal distribution (Shapiro-Wilk test), the one-way analysis of variance (ANOVA) was adopted to analyze the differences in NFC or FC levels among different city groups, otherwise, the Kruskal-Wallis test was used.
 (1)
(1)
 (2)
(2)
Annotations of all identified VOCs, mRNA and proteins were performed using the KEGG pathway (http://www.genome.jp/kegg/). Transcripts with a threshold of fold change >2 or <0.5 and a p_adjust value <0.05 (p_adjust values were calculated by correcting p-values using the FDR method) were considered as different expression genes (DEGs) which were further used for KEGG enrichment analysis (p_adjust value <0.05). The thresholds of fold change (>1.2 or <0.83) and p-value < 0.05 were used to identify differentially expressed proteins (DEPs) which were further used for KEGG enrichment analysis (p-value < 0.05). Spearman’s correlation coefficients were used to analyze the correlations among PM components, FC or NFC levels of VOC, DEGs and DEPs based on R software, version 4.2.0 (R Foundation for Statistical Computing, Vienna, Austria). The principal component analysis (PCA) was performed using R 4.2.0 to differentiate VOCs, DEPs or DEGs profiles from different exposure groups. Omics pathways maps were conducted based on the iPath drawing website (https://pathways.embl.de/ipath3.cgi?map=metabolic). Spearman correlation coefficient was used to analyze the correlation between VOCs NFC values and DEGs FC values after PM exposure in 31 cities. p-value < 0.05 was considered to be significantly correlated, and the relevant VOCs were further used for KEGG enrichment analysis. Pathways with p_adjust values < 0.05 were considered to be significantly enriched. For the regression model of PM components and VOCs profiles, PCA was used to reduce the dimensionality of VOCs profiles of each pathway based on SPSS software (IBM, NY, USA), principal components with eigenvalues greater than 1 were selected to calculate the score through eq. (3). Stepwise regression models of PM components and the scores were constructed based on SPSS software (IBM, NY, USA). The models with variance inflation factor (VIF) >10 were excluded. All the figures were made by R 4.2.0 and Origin (Pro), version 2020b (OriginLab Corporation, Northampton, MA, USA).
 (3)
(3)
RESULTS AND DISCUSSION
VOC profiles of S. cerevisiae in response to PM exposure from 31 major Chinese cities
Here, hourly changes in VOCs profiles of yeast cells within 6 h were analyzed after exposure to PM from 3 different Chinese cities (Figure S1, see Supporting Information 1 for details). According to the time series of VOC fold changes, the differences in VOCs profiles in the three cities’ groups were more obvious after 3 h PM exposure. Therefore, in order to explore the health effects of different PM samples on yeast cells, PM samples from 31 major Chinese cities were exposed to S. cerevisiae. VOC profiles and yeast cells’ concentration were detected after 3 h’ exposure. After 3 h PM exposure, the concentration changes (after exposure /before exposure) of S. cerevisiae from Beijing (average ± standard deviation: 1.872 ± 0.128), Chengdu (1.803 ± 0.316) and Nanning (1.733 ± 0.250) groups were observed to be lower than that of the control group (2.585 ± 0.310) (p-value < 0.05) as presented in Figure 1a. The changes in S. cerevisiae concentration indicated that PM exposure inhibited cell reproduction in the above three city groups, which also suggested the difference in the health effects of PM from different cities. However, the results in Supporting Information 1 showed that no significant difference was observed in the change ratios (after exposure /before exposure) of yeast cell concentrations between the Beijing group and the control group after 6 h PM exposure. It seems to indicate that the effect of PM exposure on yeast cell concentration in the Beijing group was first inhibited and then stimulated so as to be consistent with that in the control group at 6 h.
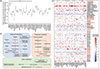 |
Figure 1 Concentrations and VOCs profiles of S. cerevisiae in response to PM exposure from 31 major Chinese cities. (a) Changes in the concentrations of S. cerevisiae. (b) Metabolism pathways of VOCs. (c) Normalized fold changes of VOCs. “(1)” and “(2)” represent monomer and dimer ions in the IMS, respectively. Some VOCs were labeled as Area # which means the GC-IMS library does not have an existing compound that matches the corresponding retention index and drift time. Their retention index and drift time were presented in Table S6. “*” and “**” represent the significant difference in VOC normalized fold change between PM exposure groups and control groups with the p-value < 0.05 and 0.001, respectively. |
Normalized by yeast cell concentrations, normalized fold change (NFC) was calculated by eq. (2) in “Methods” as illustrated in Figure 1c. A total of 60 VOCs were found to be significantly different between PM exposure groups and control group (p-value < 0.05) which were defined as different expression VOC with the abbreviation of DEV as present in Figure 1c. According to KEGG pathway database, there were three pathways with more than one DEV including propanoate metabolism pathway (carbohydrate metabolism), butanoate metabolism pathway (carbohydrate metabolism) and sulfur metabolism pathway (energy metabolism) as shown in Figure 1b. In propanoate metabolism pathway, compared with the control group, the consumption of propionaldehyde decreased (23 out of 31 city groups) and the release of 1-propanol increased (25 out of 31 city groups) in most cities’ groups which may be the results of the inhibition of propanoyl-CoA production.
Among the 60 DEVs, the NFC levels of 17 VOCs showed significant differences among the 31 city groups (PM exposure groups) after 1 h exposure or later (p-value <0.05), but no significant difference was observed among 31 city groups at 0 h’ exposure (p-value > 0.05) as present in red font in Figure 1c. The different changes of VOCs after exposure to PM from different cities suggest the different health impacts of PM exposure on yeast cells. And these VOCs could have the potential to serve as biomarkers to distinguish the health effects of different PM exposure.
Transcriptomic signatures of S.cerevisiae in response to PM exposure from 31 major Chinese cities
In order to further understand the effects of PM exposure on yeast cells and the physiological mechanisms of changes in VOC profiles, the transcriptome was employed to analyze the changes in gene expression of yeast cells after 3 h exposure to PM from 31 Chinese cities. After the alignment of the clean reads to the reference genome, a total of 5851 genes were identified. In response to 3 h PM exposure, the gene expression levels were significantly different from those in the control group with the numbers of DEGs ranging from 16 (PM from Jinan) to 884 (PM from Shanghai) as illustrated in Figure 2a. This indicated that yeast cells responded differently when exposed to PM from different sources on the genetic level. The Venn analysis of 31 cities’ DEGs shows the unique DEGs of each city and the DEGs that are identical to other cities (Table S1). For example, a total of 53 DEGs were unique to the Changchun group. The expression of one gene (FIT2 which is related to the retention of siderophore-iron in the cell wall [29]) was changed in all city groups.
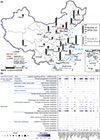 |
Figure 2 Transcriptomic signatures of S. cerevisiae in response to PM exposure from 31 major Chinese cities. (a) Numbers of DEGs. (b) Enrichment pathways of transcriptome (p-adjust value <0.05). |
Enrichment analysis showed that some pathways have been significantly affected after PM exposure (Figure 2b). Among them, significant down-regulations in carbohydrate metabolism pathways were observed after exposure to different PM samples as shown in Figure 2b. The down-regulation of enzymes associated with carbohydrate metabolism is associated with the mechanism of lipid rearrangement and accumulation to ensure cellular homeostasis and protect yeast cells from stress [30]. In addition, ribosome biogenesis in eukaryotes (19 out of 31 city groups) and lysine biosynthesis (21 out of 31 city groups) were significantly up-regulated when exposed to PM from most city groups. Toxicological results showed that the reduction of genes encoding ribosome biogenesis is a common early transcriptional regulation mechanism to acute metal exposure [18]. Although metals are important components of PM toxicity, most ribosome-related genes are up-regulated after PM exposure which may be due to the differences in exposure dose and the combined toxicity of other PM components. Up-regulation in lysine biosynthesis pathway was also found when the yeast cells were exposed to O3 and H2O2 which contributed to antioxidation defense [31]. Here, the changes in the lysine biosynthesis pathway may be related to the oxidative stress induced by PM exposure. However, no pathway was significantly enriched after exposure to PM from some cities such as Hefei and Zhengzhou (Figure 2b). The PM components from these two cities could be very different from those of other cities.
Proteomic signatures of S. cerevisiae in response to PM exposure from 5 major Chinese cities
In order to analyze the changes in protein expression, Tandem mass tag (TMT)-labeled quantitative proteomic analysis was employed to perform proteomics analysis in yeast cells of exposure groups (PM from 5 cities) and control groups. Unlike a large number of DEGs, the numbers of different expression proteins (DEPs) after 3 h PM exposure were less. A total of 4185 proteins were identified with 6 (PM from Harbin) to 114 (PM from Beijing) DEPs after 3 h PM exposure as illustrated in Figure 3b. The Venn diagram of five cities’ DEPs shows the unique DEPs of each city group and the DEPs that are identical with other city groups (Figure 3c and Table S2). For example, a total of 74 DEPs are unique to the Beijing group, and a total of 11 DEPs were identical to Nanjing group. PCA results indicated that the changes in yeast protein expression after PM exposure from the Beijing group were significantly different from those of the other four city groups (Figure 3d).
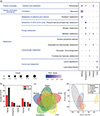 |
Figure 3 Proteomic signatures of S. cerevisiae in response to PM exposure from 5 major Chinese cities. (a) Enrichment pathways of transcriptome (p-value < 0.05). (b) Numbers of DEPs. (c) Venn diagram of five city groups’ DEPs. (d) PCA results of five city groups’ DEPs. |
Enrichment analysis showed that 7, 4, 4, 3, and 2 pathways were significantly affected after exposure to PM from Guangzhou, Harbin, Nanjing, Beijing and Xi’an, respectively (Figure 3a). Among them, the methane metabolism pathway (up-regulated) was enriched in 3 city groups and DEPs were also found in the other two groups (although not significantly enriched). The methane metabolism pathway was one of energy metabolism in the KEGG classification. The up-regulation of DEPs in methane metabolism found in all five city groups may be due to the need for more energy in response to PM exposure stress. The ribosome pathway was only enriched in the Beijing group (12 out of 13 DEPs were down-regulated) while lysine degradation (up-regulated) and lysine biosynthesis (up-regulated) were only enriched in the Xi’an group. These observed differences suggest that PM samples from different cities indeed cause different responses to the living systems.
Mechanisms of VOC profile changes of S. cerevisiae in response to different PM exposure
The combined analysis of multiple omics can help in understanding the mechanisms of the detected VOCs changes after PM exposure. Figures S2 and S3 illustrate the multi-omics changes in yeast metabolic pathways after exposure to PM samples from 31 Chinese cities. Common changes in some pathways at multiple omics levels have been observed (Supporting Information 2). In order to further analyze the mechanism of the detected VOCs change, genes significantly correlated with VOC NFC values were enriched as shown in Figure 4. According to KEGG classification, the genes significantly associated with VOCs were significantly enriched in six categories (cellular processes, genetic information processing, human diseases, metabolism, and organismal systems). Some pathways were significantly associated with the same VOCs profiles. For instance, the VOCs which were significantly associated with both chemical carcinogens-reactive oxygen species and oxidative phosphorylation pathway were 2-methyl-1-propanol (1) (“(1)” represent monomer ions in the IMS), 3-methyl-3-buten-1-ol and heptanal. The mitochondrial electron transport chain can generate cellular adenosine triphosphate (ATP) through oxidative phosphorylation by utilizing electron transport reactions. Electron transport can lead to the generation of reactive oxygen species (ROS), which leads to homeostasis signaling and oxidative stress in the pathological process [32]. According to the KEGG database, increased ROS generation was often associated with DNA damage which can lead to mutations and therefore may play an important role in the initiation and progression of multistage carcinogenesis [33]. ROS can be generated by induction of cytochrome P450 isoenzymes during detoxification of chemical carcinogens [33]. Studies have shown that the increase of ROS levels in cancer cells could promote random lipid peroxidation, resulting in the production of various aldehydes [34]. Heptanal was one of the most reported aldehydes in the exhaled breath of lung cancer patients [34]. In addition, all of the VOCs which were significantly associated with three neurodegenerative pathways (Alzheimer’s disease, Parkinson’s disease and Prion disease) were isoamyl acetate, heptanol and isoamyl acetate (1). Amyotrophic lateral sclerosis, Huntington disease and thermogenesis were all significantly related to 3-methyl-3-buten-1-ol and heptanal. Studies have suggested that the pathogenesis of various diseases, including neurodegenerative diseases, is related to oxidative stress [35]. Increased thermogenesis is a common feature of the acute phase response and can be observed in injury, inflammation, infection, and some chronic diseases [36]. ROS can also be produced during thermogenesis [37]. Therefore, the detected changes in the VOCs mentioned above may be related to oxidative stress after PM exposure and the VOCs may have the potential to serve as fingerprints of relevant pathways.
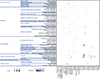 |
Figure 4 Enrichment pathways of genes of S. cerevisiae which were significantly correlated with VOCs in response to PM exposure from 31 major Chinese cities. “(1)” and “(2)” represent monomer and dimer ions in the IMS, respectively. Some VOCs were labeled as Area # which means the GC-IMS library does not have an existing compound that matches the corresponding retention index and drift time. Their retention index and drift time were presented in Table S6. |
Different PM component profiles result in unique gene and VOC profiles of S. cerevisiae
The differences in PM components are an important reason for the differences in VOCs released by yeast cells after PM exposure from different cities. The concentrations of PM components were observed to be significantly correlated with the NFC values of several VOCs (Supporting Information 3). In order to further analyze the effect of PM components on VOCs, the key components that affect the VOCs profiles of each pathway were analyzed by stepwise regression analysis. The standardized coefficients were shown in Figure 5 and the adjusted R2 values were shown in Table S3. Consistent with previous studies [18,38–42], chemical components including polycyclic aromatic hydrocarbons (PAHs) and metals can play important roles in the effects of PM exposure on yeast cells and were selected as key factors in the regression models. Table S4 shows the expression changes of several common metal functional genes after PM exposure and their correlations with metal concentrations. The toxigenic and detoxification mechanisms of different metals [38] are also summarized in Table S4. For instance, the flow of metal to cells can be reduced through the expression of related transporters and/or inhibition of transport [18]. Significant correlations were observed between the concentration of some metal elements and the expression of their transporter genes (Table S4). For example, the Cu transporter CTR1 gene was found to be significantly correlated with the concentration of Cu element (r-value = 0.887, p-value < 0.001). The CTR1 gene has extensive homology with the human gene hCTR1/hCTR2 [43]. In addition, yeast cells can neutralize metal elements by chelating metal and glutathione. Low-molecular-weight cysteine-rich proteins and peptides such as glutathione and metallothionein are important contributors to metal detoxification [44]. In this study, metal elements were identified as key factors in VOCs fingerprint regression models of various amino acid metabolic pathways (Figure 5). Significant up-regulation of genes related to amino acid biosynthesis mechanisms is an important detoxification pathway for yeast in response to metal exposure [18]. In addition, some organic components were also identified as key factors in VOCs fingerprint regression models of multiple gene expression pathways such as PAHs (Figure 5). Studies have shown that exposure to PAHs can produce toxicity to a variety of model organisms including yeast, and is also highly toxic to humans including carcinogenicity and mutagenicity [39,40]. Benzo(a)pyrene was identified as a key factor in the regression models of chemical carcinogens-reactive oxygen species and oxidative phosphorylation pathways, suggesting that PAHs exposure in PM may induce oxidative stress in yeast cells which was consistent with the results of previous studies [41,45]. In addition, PAHs were also identified as important factors in regression models including amino acid metabolic pathways (Figure 5), which is consistent with the results of the PAHs exposure study [42].
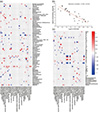 |
Figure 5 The correlations between PM components and VOC profiles of the enriched gene pathways in S. cerevisiae. Standardized coefficients of regression models between VOC profiles of the enriched gene pathways in S. cerevisiae and PM biological (a) as well as chemical (c) components. Scatter plot and correlation of copper (Cu) concentration and fold changes of gene YPR124W (b). |
In addition to the important role of chemical components in PM health effects, the results of this study revealed that microbial components may also play important roles in the effects of PM exposure on yeast cells. A variety of microbes were selected as key components in the glycolysis, amino acid metabolism and sulfur metabolism pathways (Figure 5). The chemical components generated by microbes can affect yeast cell metabolism [46–50].
CONCLUSION
In this study, PM exposure was shown to significantly affect the VOCs profiles released from a eukaryote model organism S. cerevisiae which varied among PM samples from different cities. Our results showed that VOCs have the potential to serve as biomarkers for distinguishing and monitoring the health effects of different PM exposures in vivo. The effects of 3 h PM exposure on gene and protein expression of S. cerevisiae were mainly enriched in metabolism pathways which varied among PM samples from different cities. Based on multi-omics analysis, VOCs can serve as fingerprints for different KEGG pathways with the potential to identify different health effects. The genes significantly associated with VOCs are significantly enriched in six major KEGG groups, including cellular processes, genetic information processing, human diseases, metabolism, and organismal systems. The difference in PM components is an important reason for the difference in VOCs released from S. cerevisiae in response to different PM exposure. In addition to chemical components, microbial components also play important roles in PM health effects. This study revealed the specific changes in VOCs profiles, transcriptomic and proteomic signatures of S. cerevisiae after exposure to PM from different cities. Potential VOCs biomarkers and key PM components of different KEGG pathways were also identified, providing important information for the health effects of different PM components. Our results provided a basis for using VOC profiles to probe the PM health effects in vivo which has obvious advantages such as non-invasive and time-resolved features compared with current epidemiological and toxicological methods.
Data availability
The original data are available from corresponding authors upon reasonable request.
Funding
This work was supported by the National Natural Science Foundation of China (NSFC) Creative Research Group Funds (22221004), the Guangzhou National Lab Grant (SRPG22-007), and the National Key Research & Development Program of China (2022YFC3702801, 2023YFC3708200).
Author contributions
L.Z. performed experiments, drafted the original work, and carried out investigations. H.L., Q.X., and H.C. conducted experiments. M.Y. contributed to conceptualization, supervised the study, and revised the manuscript.
Conflict of interest
The authors declare no conflict of interest.
Supplementary information
Supplementary file provided by the authors. Access Supplementary Material
Supplementary file provided by the authors. Access Supplementary Material
References
- Health Effects Institute. State of Global Air 2024. Boston, 2024 [Google Scholar]
- Gu X, Li Z, Su J. Air pollution and skin diseases: A comprehensive evaluation of the associated mechanism. Ecotoxicol Environ Saf 2024; 278: 116429. [Article] [Google Scholar]
- You R, Ho YS, Chang RCC. The pathogenic effects of particulate matter on neurodegeneration: A review. J Biomed Sci 2022; 29: 15. [Article] [Google Scholar]
- Macchi C, Sirtori CR, Corsini A, et al. Pollution from fine particulate matter and atherosclerosis: A narrative review. Environ Int 2023; 175: 107923. [Article] [Google Scholar]
- Zhang L, Yao M. Ambient particle composition and toxicity in 31 major cities in China. Fundam Res 2024; 4: 505-515. [Article] [Google Scholar]
- Li J, Chen H, Li X, et al. Differing toxicity of ambient particulate matter (PM) in global cities. Atmos Environ 2019; 212: 305-315. [Article] [Google Scholar]
- Xu J, Wang P, Li T, et al. Exposure to source-specific particulate matter and health effects: A review of epidemiological studies. Curr Pollut Rep 2022; 8: 569-593. [Article] [Google Scholar]
- Stanaway JD, Afshin A, Gakidou E, et al. Global, regional, and national comparative risk assessment of 84 behavioural, environmental and occupational, and metabolic risks or clusters of risks for 195 countries and territories, 1990–2017: A systematic analysis for the Global Burden of Disease Study 2017. Lancet 2018; 392: 1923-1994. [Article] [CrossRef] [PubMed] [Google Scholar]
- Lelieveld J, Evans JS, Fnais M, et al. The contribution of outdoor air pollution sources to premature mortality on a global scale. Nature 2015; 525: 367-371. [Article] [CrossRef] [PubMed] [Google Scholar]
- Li J, Liu F, Liang F, et al. Long-term effects of high exposure to ambient fine particulate matter on coronary heart disease incidence: A population-based Chinese cohort study. Environ Sci Technol 2020; 54: 6812-6821. [Article] [Google Scholar]
- Chen H, Li X, Yao M. Rats sniff off toxic air. Environ Sci Technol 2020; 54: 3437-3446. [Article] [Google Scholar]
- Ma H, Li J, Wan C, et al. Inflammation response of water-soluble fractions in atmospheric fine particulates: A seasonal observation in 10 large Chinese cities. Environ Sci Technol 2019; 53: 3782-3790. [Article] [Google Scholar]
- Jheng YT, Putri DU, Chuang HC, et al. Prolonged exposure to traffic-related particulate matter and gaseous pollutants implicate distinct molecular mechanisms of lung injury in rats. Part Fibre Toxicol 2021; 18: 1-6. [Article] [Google Scholar]
- Zhang L, Li X, Chen H, et al. Haze air pollution health impacts of breath-borne VOCs. Environ Sci Technol 2022; 56: 8541-8551. [Article] [Google Scholar]
- Xing Q, Zhang L, Liu H, et al. Exhaled VOC biomarkers from rats injected with PMs from thirty-one major cities in China. Environ Sci Technol 2023; 57: 20510-20520. [Article] [Google Scholar]
- Braconi D, Bernardini G, Santucci A. Saccharomyces cerevisiae as a model in ecotoxicological studies: A post-genomics perspective. J Proteom 2016; 137: 19-34. [Article] [Google Scholar]
- Gil FN, Moreira-Santos M, Chelinho S, et al. Suitability of a Saccharomyces cerevisiae-based assay to assess the toxicity of pyrimethanil sprayed soils via surface runoff: Comparison with standard aquatic and soil toxicity assays. Sci Total Environ 2015; 505: 161-171. [Article] [Google Scholar]
- Hosiner D, Gerber S, Lichtenberg-Fraté H, et al. Impact of acute metal stress in saccharomyces cerevisiae. PLoS One 2014; 9: e83330. [Article] [Google Scholar]
- Kasemets K, Käosaar S, Vija H, et al. Toxicity of differently sized and charged silver nanoparticles to yeast Saccharomyces cerevisiae BY4741: A nano-biointeraction perspective. Nanotoxicology 2019; 13: 1041-1059. [Article] [Google Scholar]
- Szostak JW, Blackburn EH. Cloning yeast telomeres on linear plasmid vectors. Cell 1982; 29: 245-255. [Article] [Google Scholar]
- Zhou Z, Elledge SJ. DUN1 encodes a protein kinase that controls the DNA damage response in yeast. Cell 1993; 75: 1119-1127. [Article] [Google Scholar]
- Takeshige K, Baba M, Tsuboi S, et al. Autophagy in yeast demonstrated with proteinase-deficient mutants and conditions for its induction.. J Cell Biol 1992; 119: 301-311. [Article] [Google Scholar]
- Lengauer C, Kinzler KW, Vogelstein B. Genetic instabilities in human cancers. Nature 1998; 396: 643-649. [Article] [CrossRef] [PubMed] [Google Scholar]
- Goffeau A, Barrell BG, Bussey H, et al. Life with 6000 genes. Science 1996; 274: 546-567. [Article] [Google Scholar]
- Botstein D, Chervitz SA, Cherry M. Yeast as a model organism. Science 1997; 277: 1259-1260. [Article] [Google Scholar]
- Zhao XG, Duan XL. Handbook of Exposure Parameters for Chinese Population (Adult Volume) (in Chinese). Beijing: China Environmental Publishing Group, 2014 [Google Scholar]
- Ministry of Ecology and Environment of the People’s Republic of China. Ambient Air Quality Standards. Beijing: China Environmental Science Press, 2012 [Google Scholar]
- Chen H, Qi X, Zhang L, et al. COVID-19 screening using breath-borne volatile organic compounds. J Breath Res 2021; 15: 047104. [Article] [Google Scholar]
- Pecoraro L, Wang X, Shah D, et al. Biosynthesis pathways, transport mechanisms and biotechnological applications of fungal siderophores. J Fungi 2021; 8: 21. [Article] [Google Scholar]
- Justinić I, Katić A, Uršičić D, et al. Combining proteomics and lipid analysis to unravel Confidor stress response in Saccharomyces cerevisiae. Environ Toxicol 2020; 35: 346-358. [Article] [Google Scholar]
- Chen H, Zheng Y, Wang M, et al. Gene-regulated release of distinctive volatile organic compounds from stressed living cells. Environ Sci Technol 2022; 56: 9546-9555. [Article] [Google Scholar]
- Nolfi-Donegan D, Braganza A, Shiva S. Mitochondrial electron transport chain: Oxidative phosphorylation, oxidant production, and methods of measurement. Redox Biol 2020; 37: 101674. [Article] [Google Scholar]
- KEGG pathway. https://www.genome.jp/pathway/map05208 [Google Scholar]
- Sutaria SR, Gori SS, Morris JD, et al. Lipid peroxidation produces a diverse mixture of saturated and unsaturated aldehydes in exhaled breath that can serve as biomarkers of lung cancer—A review. Metabolites 2022; 12: 561. [Article] [Google Scholar]
- Islam MT. Oxidative stress and mitochondrial dysfunction-linked neurodegenerative disorders. Neurol Res 2017; 39: 73-82. [Article] [Google Scholar]
- Trayhurn P. Thermogenesis. Caballero BBT-E of FS and N. 2nd ed. Oxford: Academic Press, 2003 [Google Scholar]
- Lettieri-Barbato D. Redox control of non-shivering thermogenesis. Mol Metab 2019; 25: 11-19. [Article] [Google Scholar]
- Robinson JR, Isikhuemhen OS, Anike FN. Fungal-metal interactions: A review of toxicity and homeostasis. J Fungi 2021; 7: 225. [Article] [Google Scholar]
- Ghosh P, Mukherji S. Fate, detection technologies and toxicity of heterocyclic PAHs in the aquatic and soil environments. Sci Total Environ 2023; 892: 164499. [Article] [Google Scholar]
- Barbosa Jr F, Rocha BA, Souza MCO, et al. Polycyclic aromatic hydrocarbons (PAHs): Updated aspects of their determination, kinetics in the human body, and toxicity. J Toxicol Environ Health Part B 2023; 26: 28-65. [Article] [Google Scholar]
- Gao P, da Silva E, Hou L, et al. Human exposure to polycyclic aromatic hydrocarbons: Metabolomics perspective. Environ Int 2018; 119: 466-477. [Article] [Google Scholar]
- Shen Q, Yu H, Liu Y, et al. Combined exposure of MAHs and PAHs enhanced amino acid and lipid metabolism disruption in epithelium leading asthma risk. Environ Pollution 2024; 343: 123261. [Article] [Google Scholar]
- Feldmann H. Yeast: Molecular and Cell Biology. 2nd ed. New Jersey: Wiley-Blackwell, 2012 [Google Scholar]
- Wysocki R, Tamás MJ. How Saccharomyces cerevisiae copes with toxic metals and metalloids. FEMS Microbiol Rev 2010; 34: 925-951. [Article] [Google Scholar]
- Zhou Q, Liu B, Chen Y, et al. Characterization of PAHs in size-fractionated submicron atmospheric particles and their association with the intracellular oxidative stress. Chemosphere 2017; 182: 1-7. [Article] [Google Scholar]
- Moretti S, Smets W, Hofman J, et al. Human inflammatory response of endotoxin affected by particulate matter-bound transition metals. Environ Pollution 2019; 244: 118-126. [Article] [Google Scholar]
- Hach PF, Marchant HK, Krupke A, et al. Rapid microbial diversification of dissolved organic matter in oceanic surface waters leads to carbon sequestration. Sci Rep 2020; 10: 13025. [Article] [Google Scholar]
- Lechtenfeld OJ, Hertkorn N, Shen Y, et al. Marine sequestration of carbon in bacterial metabolites. Nat Commun 2015; 6: 6711. [Article] [Google Scholar]
- Xu Y, Dong X, Xiao H, et al. Water-insoluble components in rainwater in suburban Guiyang, Southwestern China: A potential contributor to dissolved organic carbon. JGR Atmos 2022; 127: e2022JD037721. [Article] [Google Scholar]
- Samake A, Uzu G, Martins JMF, et al. The unexpected role of bioaerosols in the oxidative potential of PM. Sci Rep 2017; 7: 1. [Article] [CrossRef] [PubMed] [Google Scholar]
All Figures
|
Figure 1 Concentrations and VOCs profiles of S. cerevisiae in response to PM exposure from 31 major Chinese cities. (a) Changes in the concentrations of S. cerevisiae. (b) Metabolism pathways of VOCs. (c) Normalized fold changes of VOCs. “(1)” and “(2)” represent monomer and dimer ions in the IMS, respectively. Some VOCs were labeled as Area # which means the GC-IMS library does not have an existing compound that matches the corresponding retention index and drift time. Their retention index and drift time were presented in Table S6. “*” and “**” represent the significant difference in VOC normalized fold change between PM exposure groups and control groups with the p-value < 0.05 and 0.001, respectively. |
| In the text | |
|
Figure 2 Transcriptomic signatures of S. cerevisiae in response to PM exposure from 31 major Chinese cities. (a) Numbers of DEGs. (b) Enrichment pathways of transcriptome (p-adjust value <0.05). |
| In the text | |
|
Figure 3 Proteomic signatures of S. cerevisiae in response to PM exposure from 5 major Chinese cities. (a) Enrichment pathways of transcriptome (p-value < 0.05). (b) Numbers of DEPs. (c) Venn diagram of five city groups’ DEPs. (d) PCA results of five city groups’ DEPs. |
| In the text | |
|
Figure 4 Enrichment pathways of genes of S. cerevisiae which were significantly correlated with VOCs in response to PM exposure from 31 major Chinese cities. “(1)” and “(2)” represent monomer and dimer ions in the IMS, respectively. Some VOCs were labeled as Area # which means the GC-IMS library does not have an existing compound that matches the corresponding retention index and drift time. Their retention index and drift time were presented in Table S6. |
| In the text | |
|
Figure 5 The correlations between PM components and VOC profiles of the enriched gene pathways in S. cerevisiae. Standardized coefficients of regression models between VOC profiles of the enriched gene pathways in S. cerevisiae and PM biological (a) as well as chemical (c) components. Scatter plot and correlation of copper (Cu) concentration and fold changes of gene YPR124W (b). |
| In the text | |
Current usage metrics show cumulative count of Article Views (full-text article views including HTML views, PDF and ePub downloads, according to the available data) and Abstracts Views on Vision4Press platform.
Data correspond to usage on the plateform after 2015. The current usage metrics is available 48-96 hours after online publication and is updated daily on week days.
Initial download of the metrics may take a while.