Figure 1
Download original image
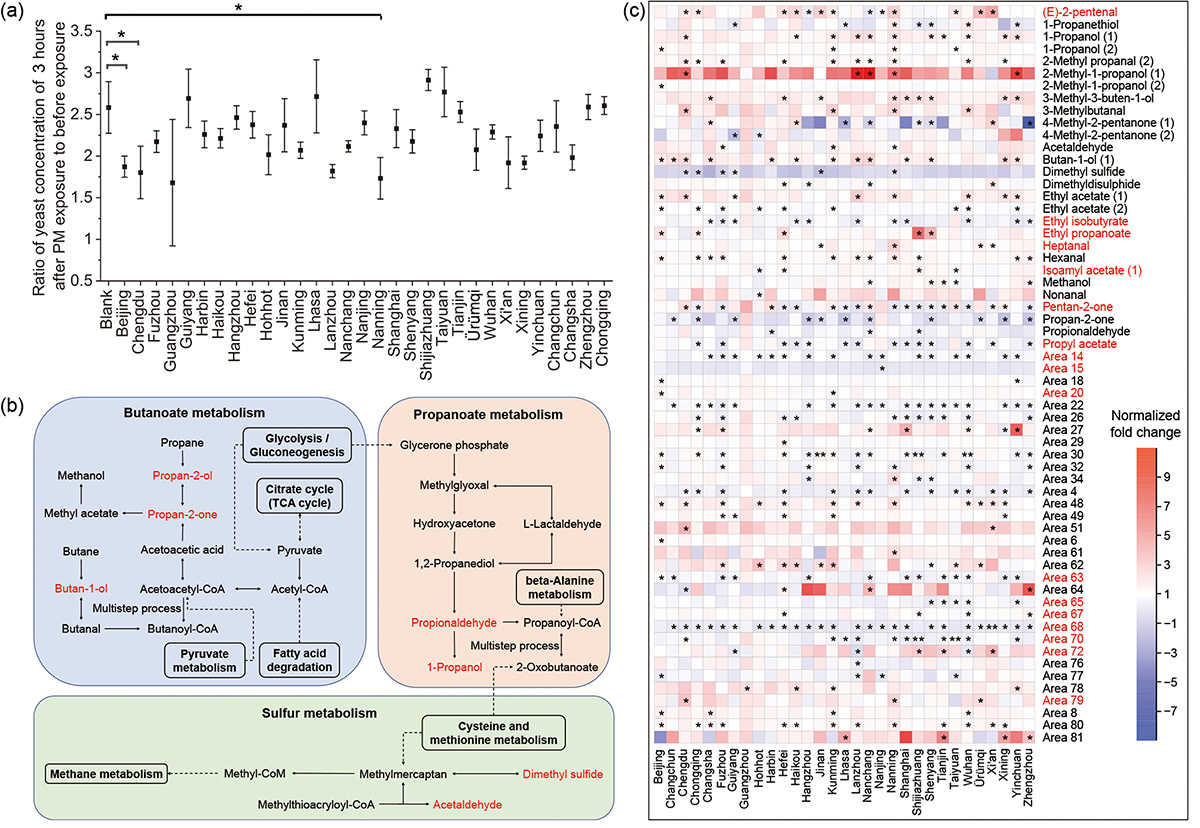
Concentrations and VOCs profiles of S. cerevisiae in response to PM exposure from 31 major Chinese cities. (a) Changes in the concentrations of S. cerevisiae. (b) Metabolism pathways of VOCs. (c) Normalized fold changes of VOCs. “(1)” and “(2)” represent monomer and dimer ions in the IMS, respectively. Some VOCs were labeled as Area # which means the GC-IMS library does not have an existing compound that matches the corresponding retention index and drift time. Their retention index and drift time were presented in Table S6. “*” and “**” represent the significant difference in VOC normalized fold change between PM exposure groups and control groups with the p-value < 0.05 and 0.001, respectively.
Current usage metrics show cumulative count of Article Views (full-text article views including HTML views, PDF and ePub downloads, according to the available data) and Abstracts Views on Vision4Press platform.
Data correspond to usage on the plateform after 2015. The current usage metrics is available 48-96 hours after online publication and is updated daily on week days.
Initial download of the metrics may take a while.