Figure 3
Download original image
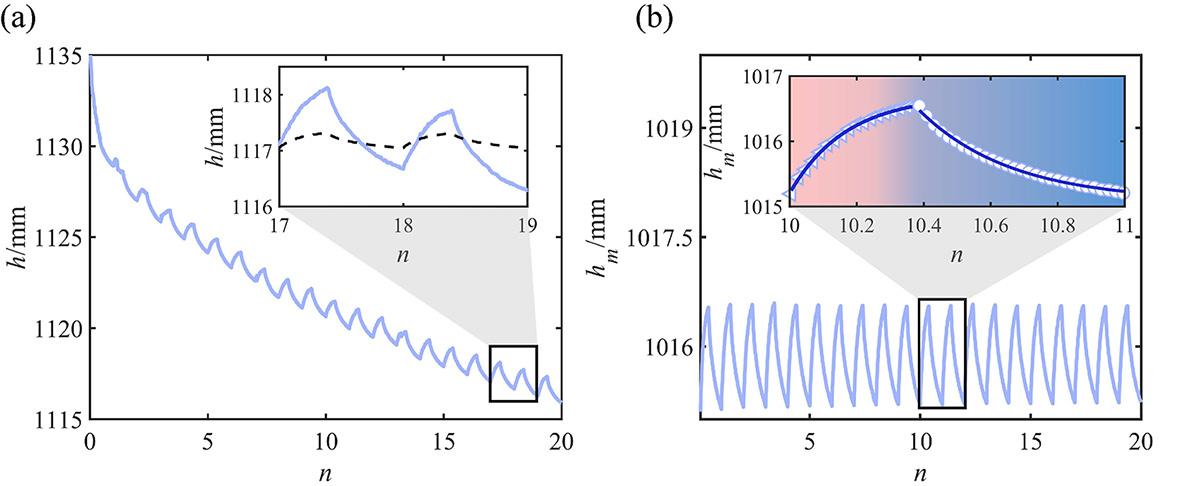
(a) Height evolution of a glass bead packing h as a function of the number of thermal cycles n under a temperature variation of ![]() 30°C. Inset: magnified portion of the compression data showing the compaction curve. The black dotted curve corresponds to the estimated height variation of glass bead packings due to the thermal dilatancy alone. (b) Height evolution of markers
30°C. Inset: magnified portion of the compression data showing the compaction curve. The black dotted curve corresponds to the estimated height variation of glass bead packings due to the thermal dilatancy alone. (b) Height evolution of markers ![]() as a function of the number of thermal cycles n. Inset: magnified portion of the compression data showing the compaction curve. Blue solid curves denote the single exponential fitting for the heating and cooling stages,
as a function of the number of thermal cycles n. Inset: magnified portion of the compression data showing the compaction curve. Blue solid curves denote the single exponential fitting for the heating and cooling stages, ![]() , respectively.
, respectively.
Current usage metrics show cumulative count of Article Views (full-text article views including HTML views, PDF and ePub downloads, according to the available data) and Abstracts Views on Vision4Press platform.
Data correspond to usage on the plateform after 2015. The current usage metrics is available 48-96 hours after online publication and is updated daily on week days.
Initial download of the metrics may take a while.